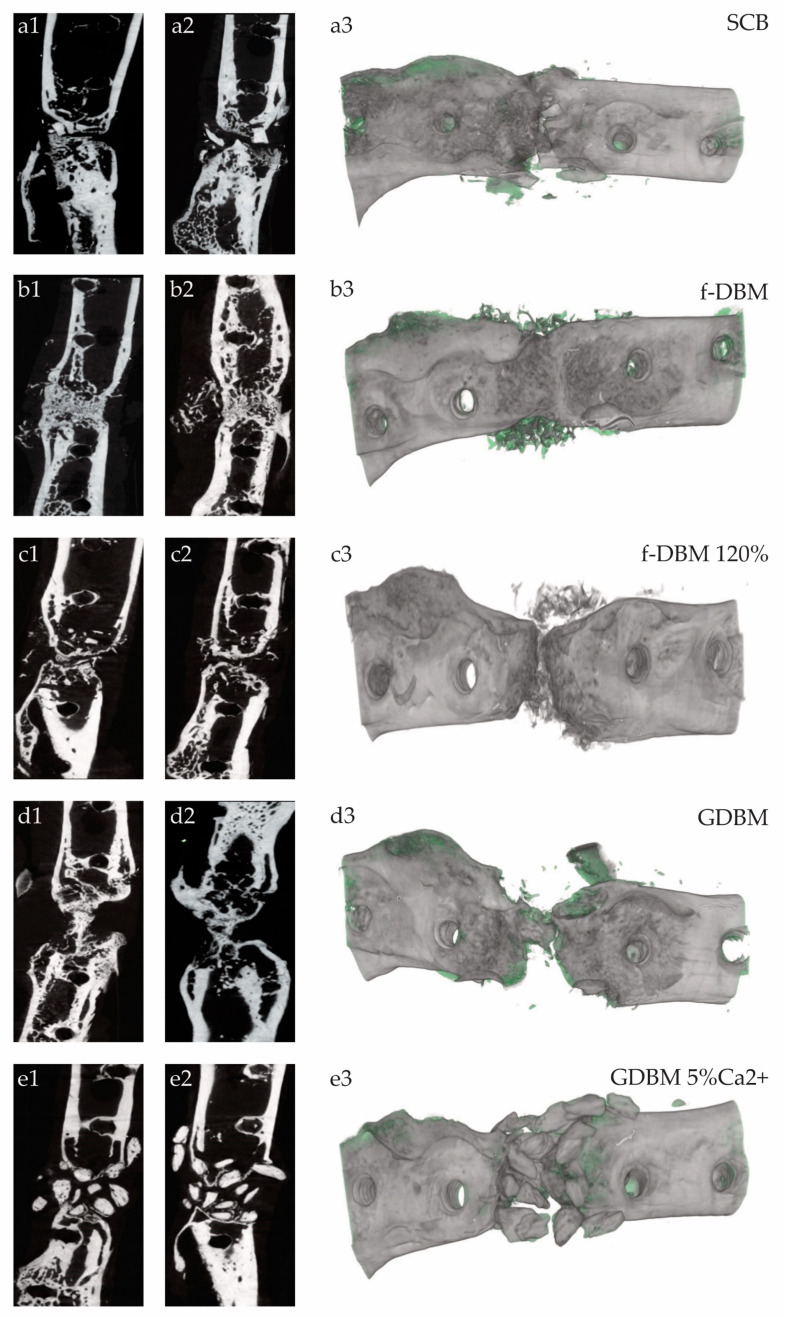
Figure 4.
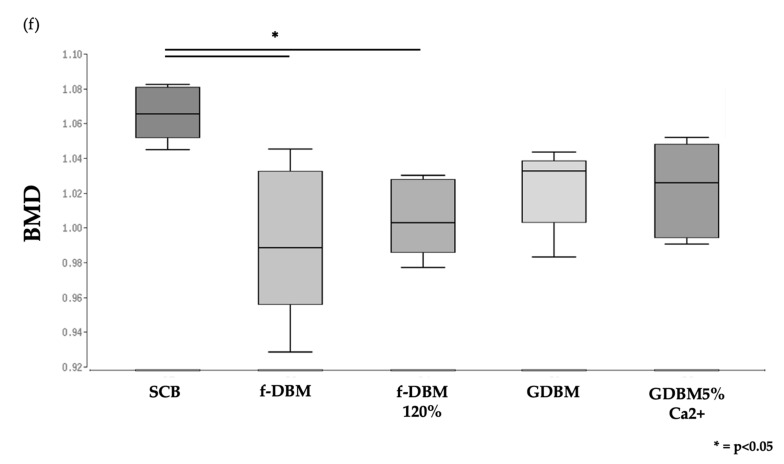
Bone healing results after 8 weeks in the different groups (a–e) in µCT slices (1–2) and 3D reconstructed (3). (a): SCB with high degree of integration. (b): f-DBM showing multiple bony bridges and almost no remnant defect size. (c): f-DBM 120% with bigger remnant defect size. (d): GDBM with remaining defect size and remaining granules. (e): GDBM5%Ca2+ with almost no osseous integration of the scaffolds. Bone mineral density (BMD) of the different groups (f). Significantly higher BMD in SCB group than in f-DBM and f-DBM 120% (* = p < 0.05).


