Figure 5.
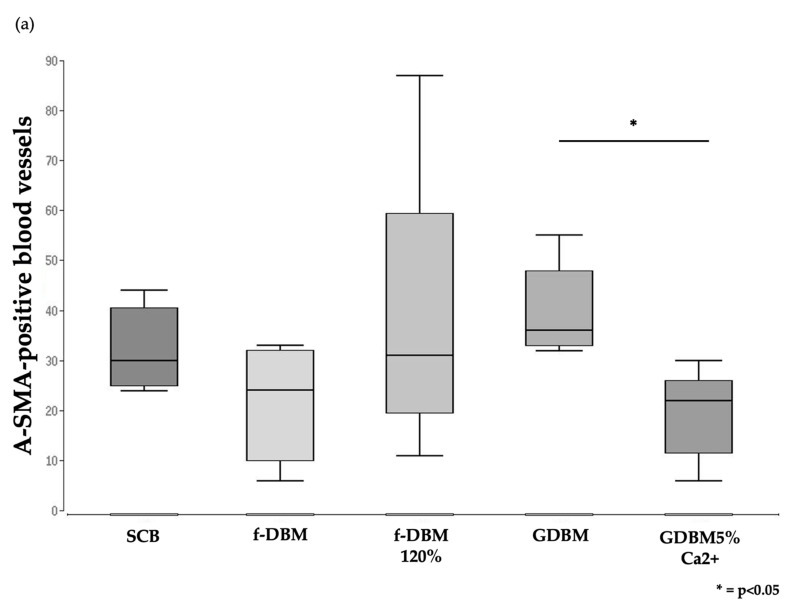
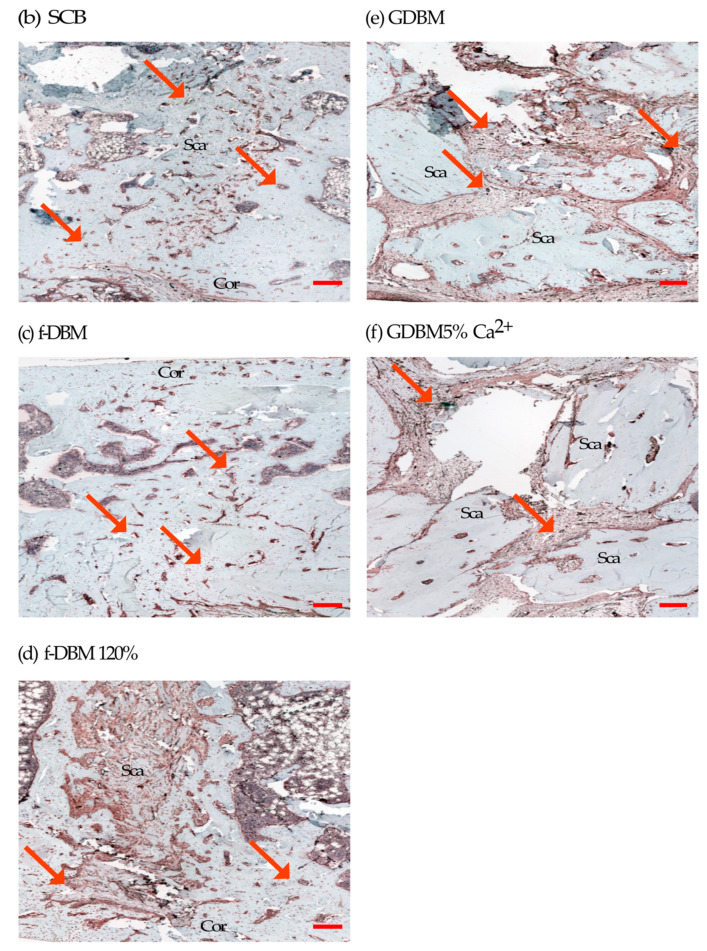
Histologically visible number of α-SMA-positive vessels within the defect area (a). Significantly fewer α-SMA-positive vessels were found in the GDBM5%Ca2+ group than in GDBM granules. Evaluation of vascularization based on immunostaining of established blood vessels, using antibodies directed against α-SMA within the whole defect. Representative images of bone defects treated with different scaffolds (b–f). α-SMA-positive vessels were more inhomogeneously distributed with a concentration in the peripheral area in the fDMB 120% group. Red arrows indicate α-SMA-positive blood vessels, Cor = corticalis, sca = scaffold. Scale bar indicates a distance of 200 μm; * p < 0.05.


