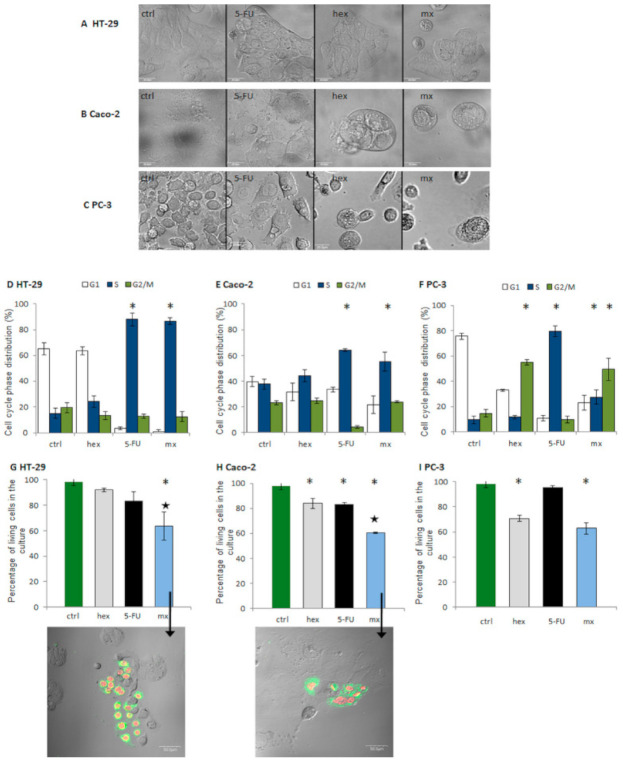
Figure 3.
Morphological changes in the HT-29 (A), Caco-2 (B), and PC-3 (C) cells treated with 5-FU, hex, and the combined treatment (mx). The changes in distribution of the cell cycle phases in colon and prostate cancer cell lines when compared to the control after the administration of the combined treatment and the individual compounds in the HT-29 (D), Caco-2 (E), and PC-3 (F) cell lines. Cell cycle distribution was determined by flow cytometry. Combination treatment: the cells were incubated with 2-oxohexyl ITC for 24 h and then with 5-FU for 72 h. In individual administrations, one component of the combination was used. The changes of the living cells percentage in the cell culture after the administration of individual compounds and the combined treatment in the Caco-2 (G), HT-29 (H), and PC-3 (I) cell lines. Large black star—statistically significant difference between the percentage of living cells after the administration of the combined treatment and after administrations of 2-oxohexyl ITC and 5-FU alone. * Statistically significant difference from the control; p < 0.05. Cell viability was determined using the FDA/PI method using flow cytometry. Apoptosis detection in HT-29 colon cancer and Caco-2 cancer cell lines is indicated by arrows in graphs (G,H). Green—cell membrane stained with Annexin V-FITC. Red—nuclei stained with PI.

