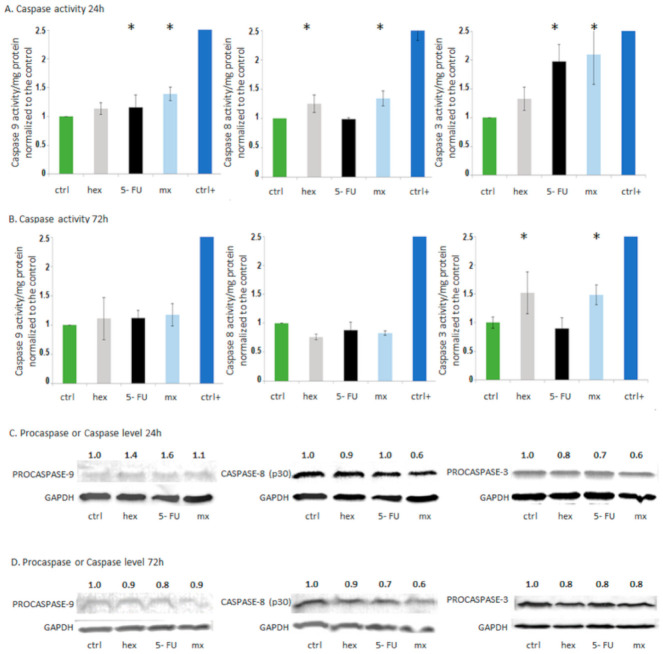
Figure 4.
Apoptosis studies. (A) Caspase (Caspase 9, Caspase 8, and Caspase 3) activity/mg protein normalized to the control (ctrl) after the combined 5-FU and 2-oxohexyl ITC treatment, individual 5-FU treatment, individual hex treatment, and positive control treatment (ctrl+) after 24 (A) and 72 h incubation (B). * Statistically significant difference from the control; p < 0.05. Changes in the levels of apoptosis-related proteins obtained by Western blotting after the administration of individual compounds, the combined treatment of 5-FU with hex, and for the control cells (ctrl) after 24-h incubation (C) and after 72-h incubation (D). Glyceraldehyde-3-phosphate dehydrogenase (GAPDH) was amplified as an internal control. The results of the bands of procaspase forms were quantified by densitometric analysis, and their intensity was normalized with respect to GAPDH.

