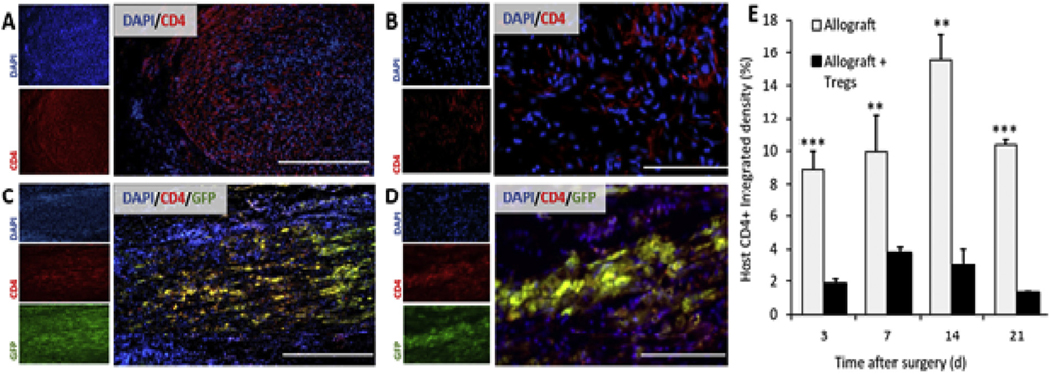
Fig. 6.
Abundance of host-derived CD4+ cells in PN allografts after implantation. (A, B) Images of PN allografts harvested 14 d after implantation and immunolabeled for CD4. (C, D). Images of PN allografts treated with GFP + Tregs harvested 14 d after implantation and immunolabeled for CD4. Yellow indicates implanted GFP + CD4+ Tregs. Scale bars in A and C = 400 μm, B and D = 100 μm. (E) Quantification of the CD4 densitometry between allografts with and without Tregs, in which GFP was used to distinguish CD4+ Tregs from host-derived CD4+ T cells. N = 3, **p < 0.005, ***p < 0.0005 by Tukey’s multivariable test. Error bars depict s.e.m. (For interpretation of the references to colour in this figure legend, the reader is referred to the Web version of this article.)

