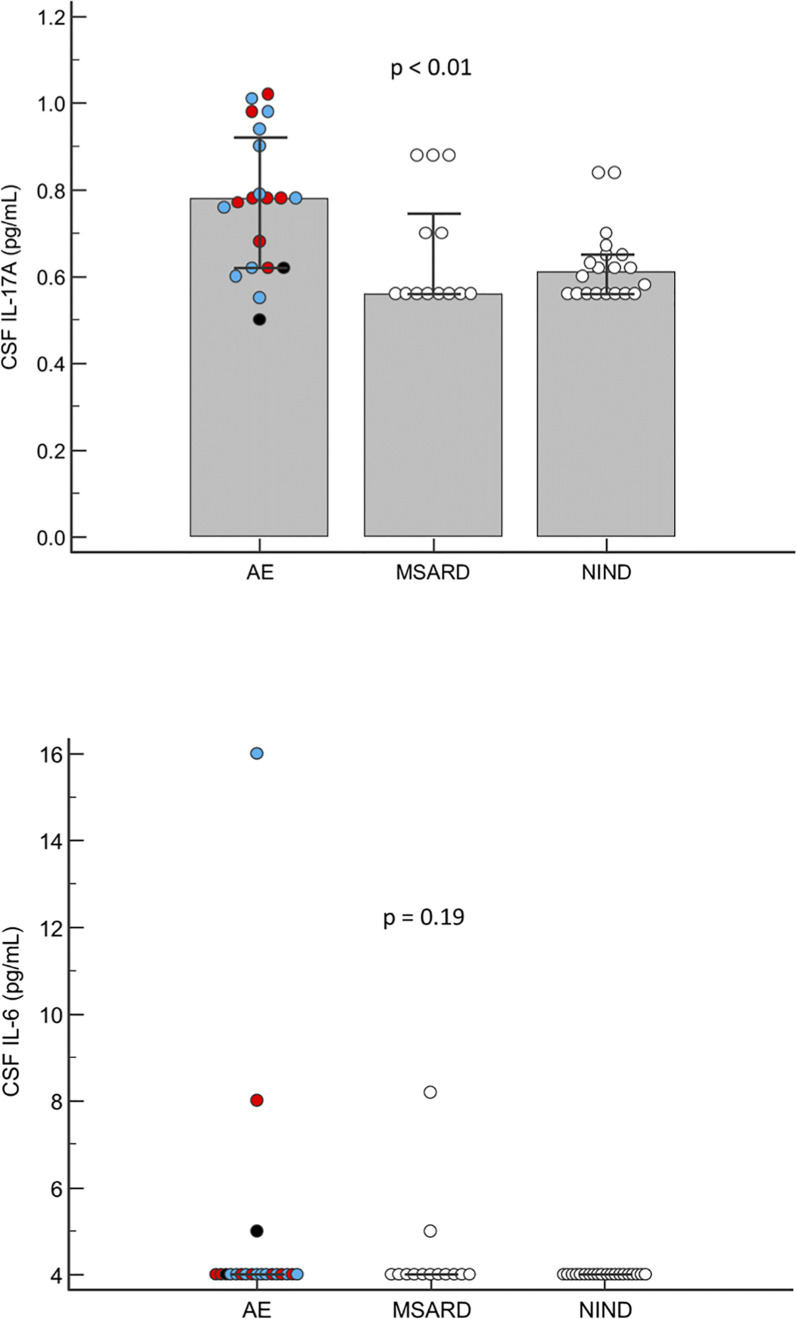
Figure 1.
Cerebrospinal fluid profiles of IL-17A and IL-6 in AE patients compared to inflammatory (MSARD) and non-inflammatory (NIND) controls. Numbers of patients in each group are: AE group (n=20), MSARD group (n=13) and NIND group (n=20). Results are expressed as medians (Kruskal-Wallis test). The blue dots correspond to anti-LGI1 LE, the red dots to other cell-surface Ab mediated AE and the black dots to seronegative LE.

