
Figure 3.
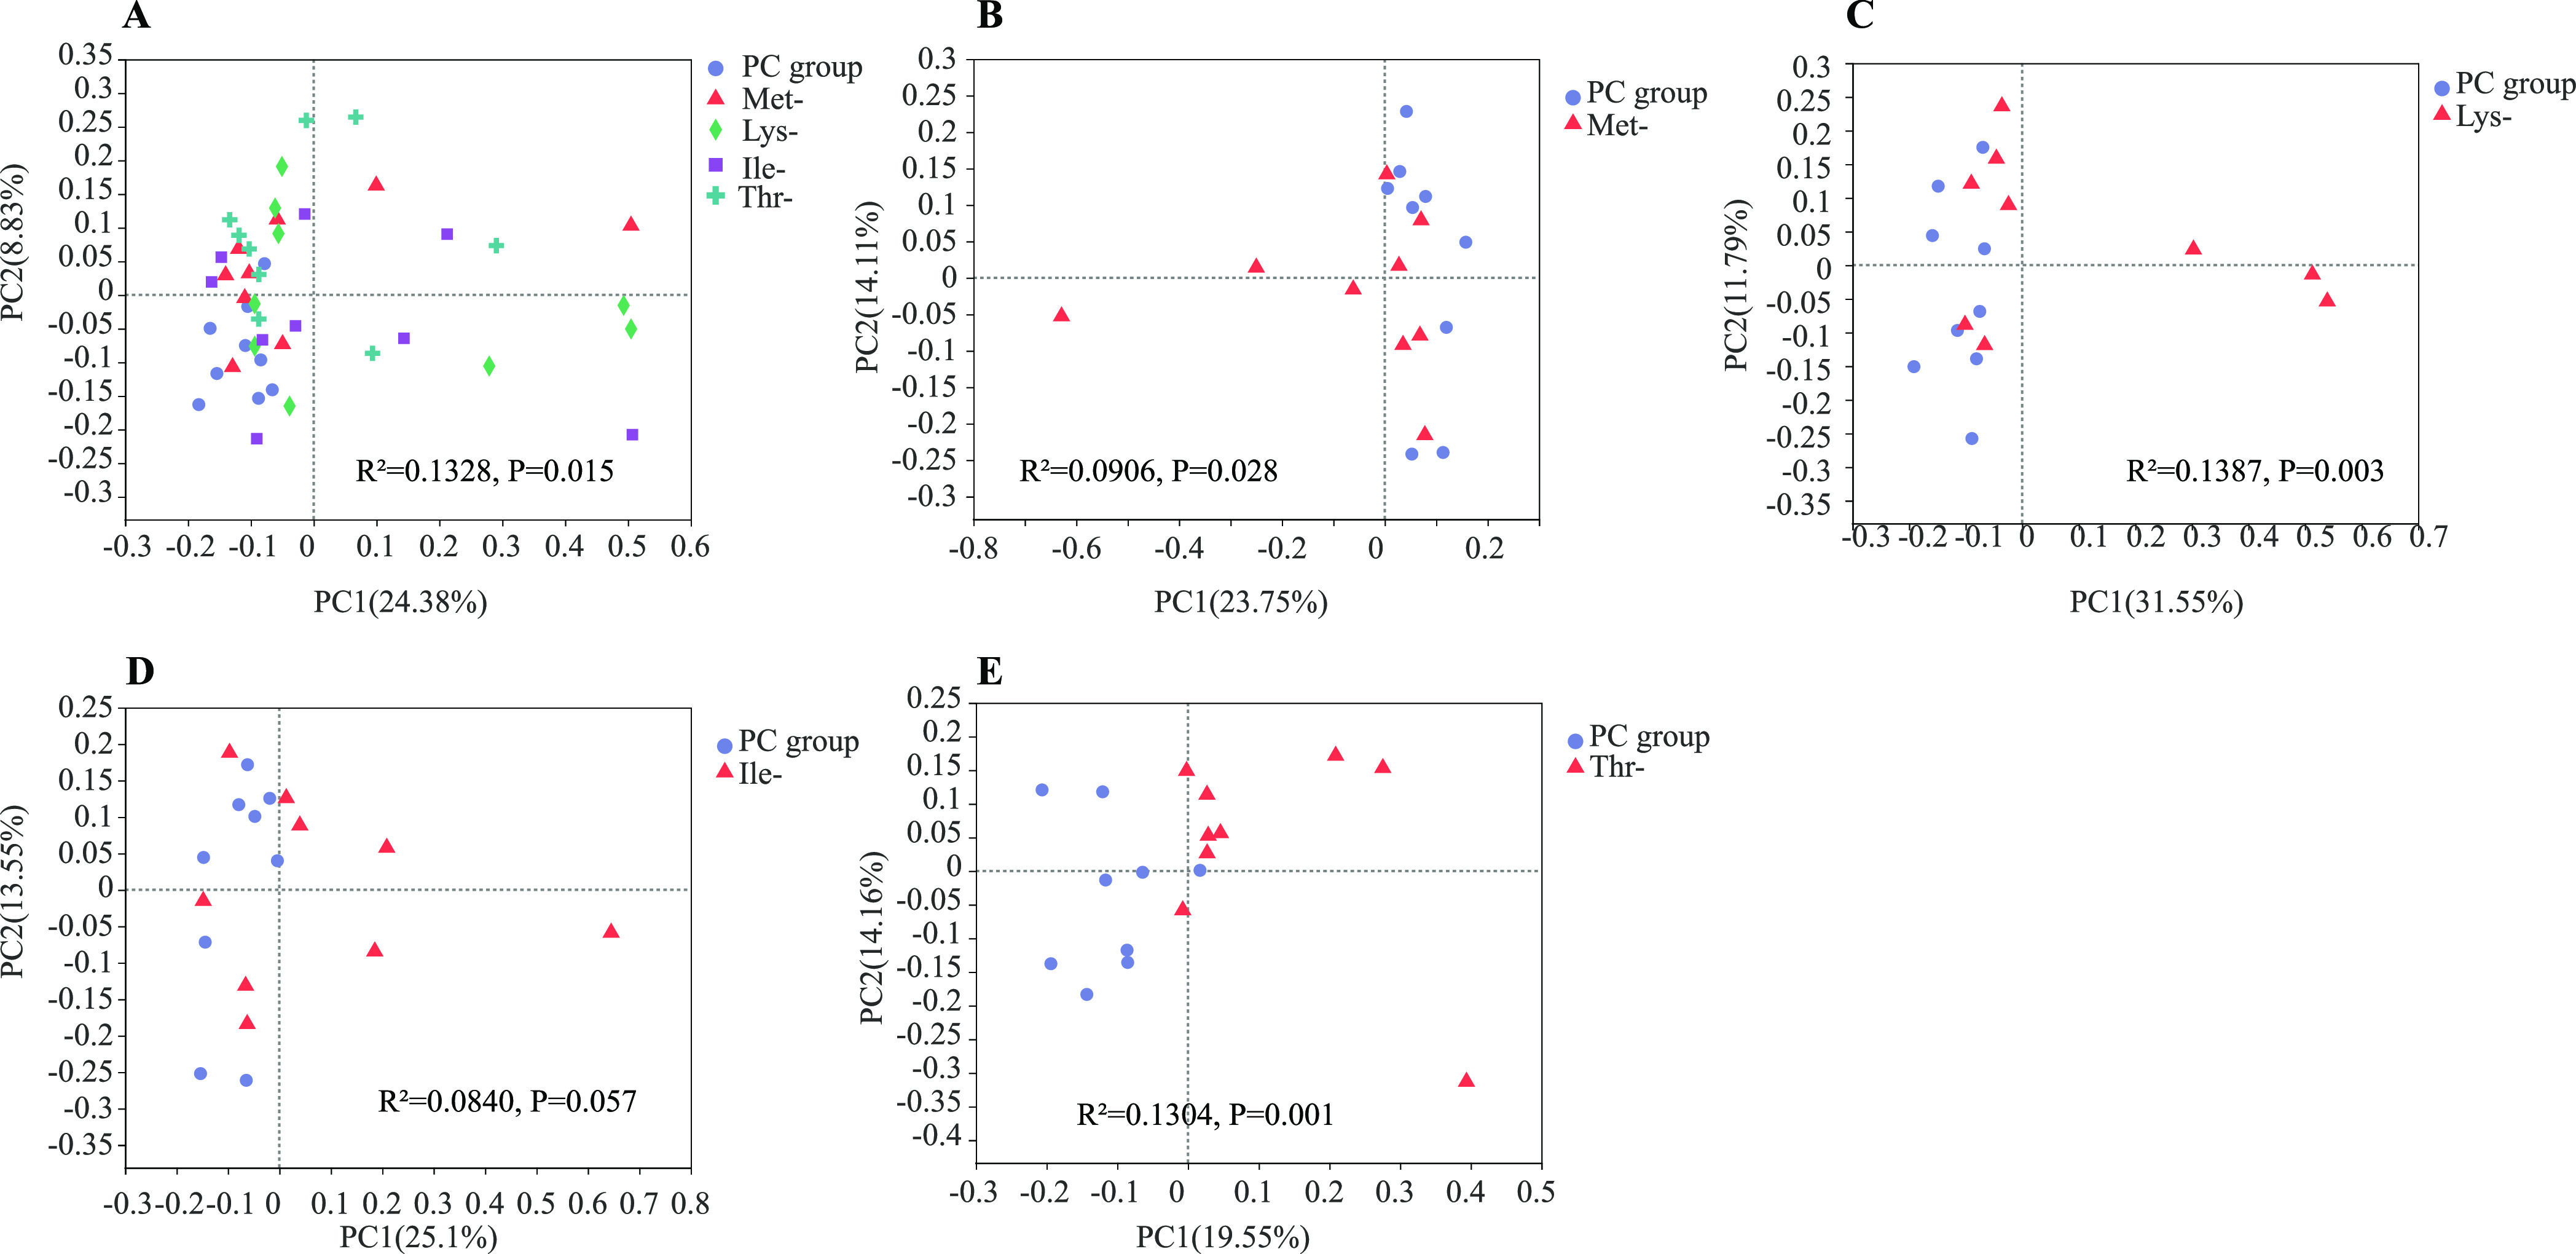
Principal coordinates analysis (PCoA, Bray–Curtis distance) plot of the gut microbial community structure between PC group, Met-group, Lys-group, Ile-group, and Thr-group. n = 9 per group.
Official websites use .gov
A
.gov website belongs to an official
government organization in the United States.
Secure .gov websites use HTTPS
A lock (
) or https:// means you've safely
connected to the .gov website. Share sensitive
information only on official, secure websites.
Principal coordinates analysis (PCoA, Bray–Curtis distance) plot of the gut microbial community structure between PC group, Met-group, Lys-group, Ile-group, and Thr-group. n = 9 per group.