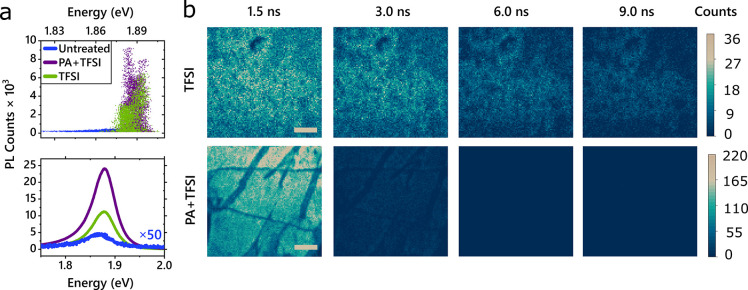
Figure 2.
PL dynamics. (a) Top: Energy (x-axis) versus maximum PL count (y-axis) for samples of each treatment condition, where each point represents a pixel of a PL map. TFSI and PA+TFSI treatments result in a blue-shift and narrowing of the peak emission energy distribution. Mean and standard deviation are shown in Supporting Information, Table 1. Bottom: Sample PL spectra illustrating the brightest spot measured under each treatment condition. With optimization, the PA+TFSI chemical treatment enhances the PL about twice as much as TFSI alone. (b) PL maps illustrating the PL magnitude and intensity as a function of time after excitation, for TFSI-treated samples (top) and PA+TFSI-treated samples (bottom). Scale bar corresponds to 4 μm. Emission of untreated samples was instrument-response-limited and thus shorter than 100 ps (see Supporting Information, Section 7).

