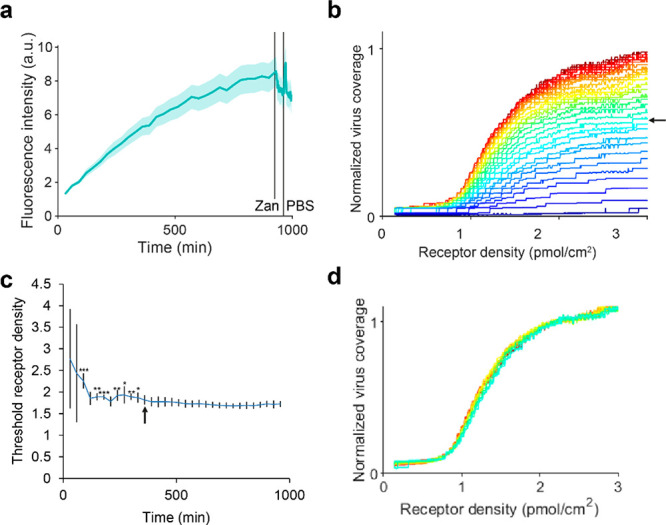
Figure 5.

Threshold receptor density of IAV particles binding to receptor gradients as a function of time in 4 corrals. (a) Development of the average fluorescence intensity over time in 100 μm corrals of a mixed corral flow cell with 2,6-S(LN)3 gradients on 0.5% biotin-DOPE. The shaded area indicates the standard error between corrals. After 930 min of PR8, the solution was changed to 200 mM Zanamivir, the flow rate to 10 μL/min and micrographs were taken every min. After 960 min, the solution was changed to PBS without NA inhibitor. (b) Development of virus binding profile over time (from 30 to 930 min). The time between frames was 30 min. The median fluorescence intensity of the virus was normalized to the highest value in the last frame. (c) Development of the threshold receptor density over time. Error bars show the standard deviation between corrals. From 360 min onward, the threshold density does not differ significantly from that of the last frame. This point is indicated with an arrow in both a and b. *: p < 0.05, **: p < 0.01, ***: p < 0.001. (d) Individually normalized virus binding profiles from 360 min onward.
