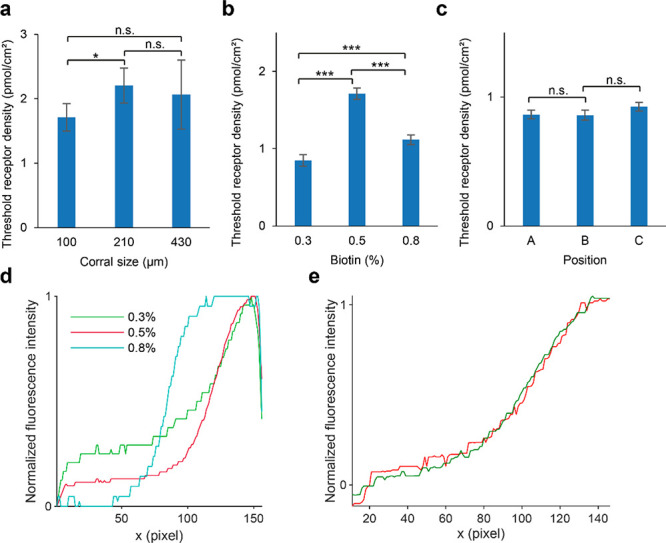
Figure 6.

Threshold densities of IAV particles binding to receptor gradients observed for different chip layouts and biotin densities. (a) Mean threshold receptor density for corrals of different sizes on gradients from 0.5% biotin-DOPE, determined for 24, 11, and 4 corrals. Error bars indicate 95% confidence interval. n.s.: not significant, *: p < 0.05. (b) Mean threshold receptor density on gradients prepared from different percentages of biotin-DOPE in 100 μm corrals, determined for 36, 24, and 46 corrals. Error bars indicate 95% confidence interval. ***: p < 0.001. (c) Mean threshold receptor density on 0.3% biotin-DOPE in 100 μm corrals for different positions in the microchannel (A–C, Figure 1a), determined for 8, 6, and 8 corrals. Gradients in A and C are with the direction of the flow through the channel; B is against the flow. Error bars indicate 95% confidence interval. n.s.: not significant. (d) Median lateral intensity profiles of SAv on gradients prepared from different percentages of biotin-DOPE in a 100 μm corral, without the edges removed from the image. (e) Median lateral intensity profiles of SAv (green) and ATTO 565-biotin (red) fluorescence on 0.5% biotin-DOPE over four 100 μm corrals, normalized to the average of the first and last 20 points of the median.
