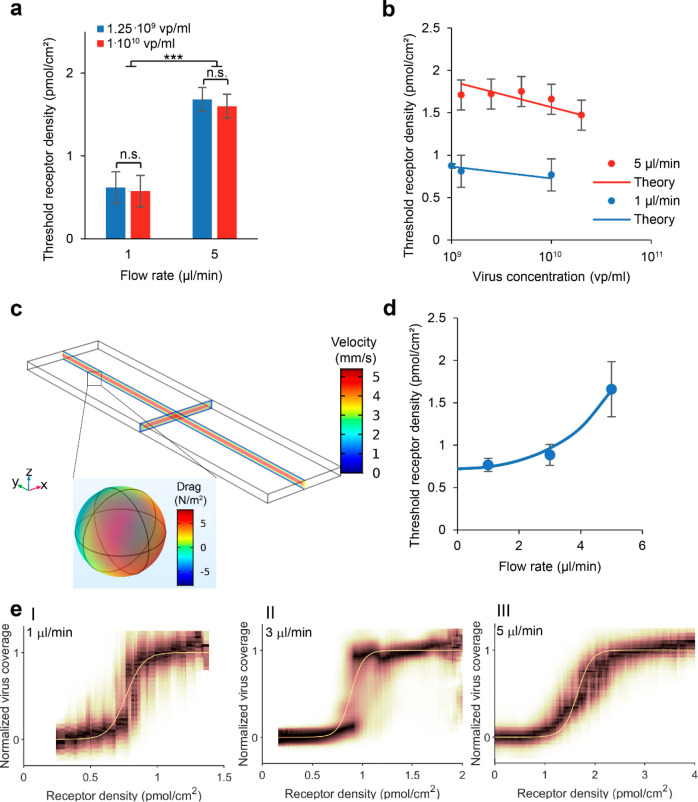
Figure 7.
Threshold receptor density of IAV particles
binding to receptor
gradients as a function of flow rate and virus concentration. (a)
Mean threshold receptor density for different virus concentrations
and flow rates, from 7 corrals for 1 μL/min and 12 for 5 μL/min.
Error bars indicate 95% confidence interval. n.s.: not significant,
***: p < 0.001. (b) Measured and predicted threshold
receptor density at different virus concentrations for different flow
rates. The theoretical change in threshold receptor density with virus
concentration is calculated separately for 1 μL/min and 5 μL/min
using eq 6 with  as fit parameter. Experimental threshold
receptor densities were evaluated over 12 corrals for 5 μL/min
and over 22, 7, and 7 corrals for 1 μL/min. Error bars indicate
95% confidence interval. (c) Finite element simulation
of laminar flow in a microchannel at a flow rate of 5 μL/min
and the resulting drag force on a 112 nm particle. (d) Fitted threshold
receptor density at different flow rates using eq 7 with the spring constant k as fit parameter, using 7, 20, and 12 corrals. Error bars indicate
standard deviation. (e) Binding profiles and fits at flow rates of
1 μL/min (I), 3 μL/min (II), and 5 μL/min (III).
For these profiles, point clouds from 7 (I), 20 (II), and 12 (III)
corrals were combined.

