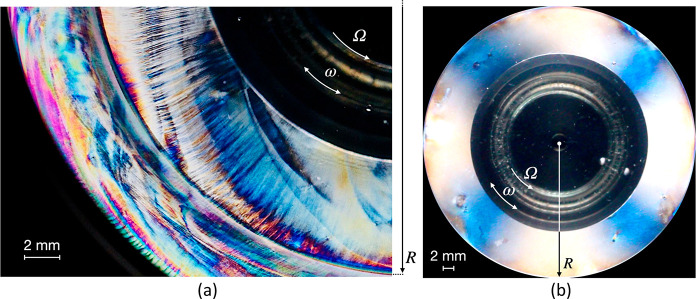
Figure 4.
(a) CNC birefringence patterns (unpublished figure provided by R.K.) visualized using a custom transmission mode setup similar to that reported elsewhere.74 The radius R marks the edge of the measuring plate radius (2R = 43 mm). The visualization was created immediately after the sample was squeezed into the measuring gap. (b) Maltese-cross pattern visualized at high shear rates through the same setup. Credit: photo courtesy of M. Fazilati; used with permission.

