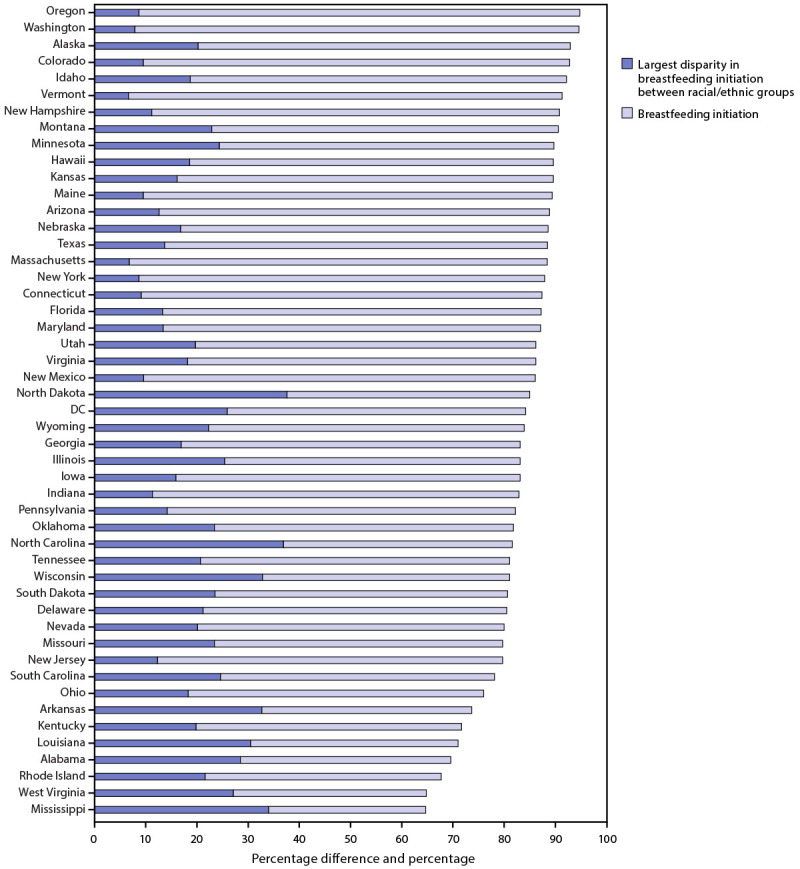
FIGURE 1.

Breastfeeding initiation and largest disparity in breastfeeding initiation between racial/ethnic groups,* by state† — National Vital Statistics System, 48 states and the District of Columbia, 2019
Abbreviation: DC = District of Columbia.
*Breastfeeding initiation is measured as a percentage. Largest disparity in breastfeeding initiation between racial/ethnic groups is measured as a percentage difference.
† Includes all states except California and Michigan. California does not report breastfeeding initiation data to the National Vital Statistics System. Michigan uses nonstandard wording for the breastfeeding initiation item on the birth certificate, which prevents comparison of data to other states.
