FIGURE 2.

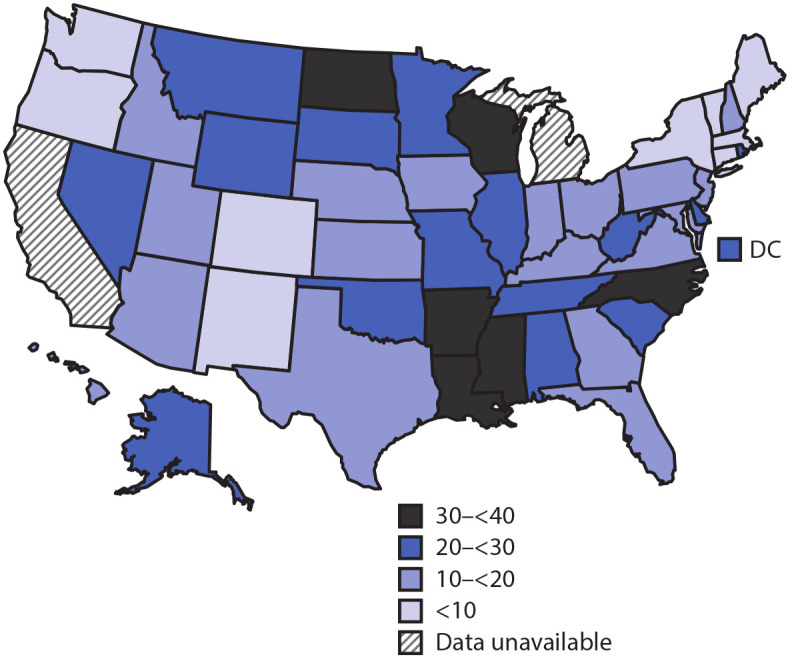
Largest disparity in breastfeeding initiation between racial/ethnic groups, by percentage point difference ─ National Vital Statistics System, 48 states and the District of Columbia, 2019
Abbreviation: DC = District of Columbia.

Largest disparity in breastfeeding initiation between racial/ethnic groups, by percentage point difference ─ National Vital Statistics System, 48 states and the District of Columbia, 2019
Abbreviation: DC = District of Columbia.