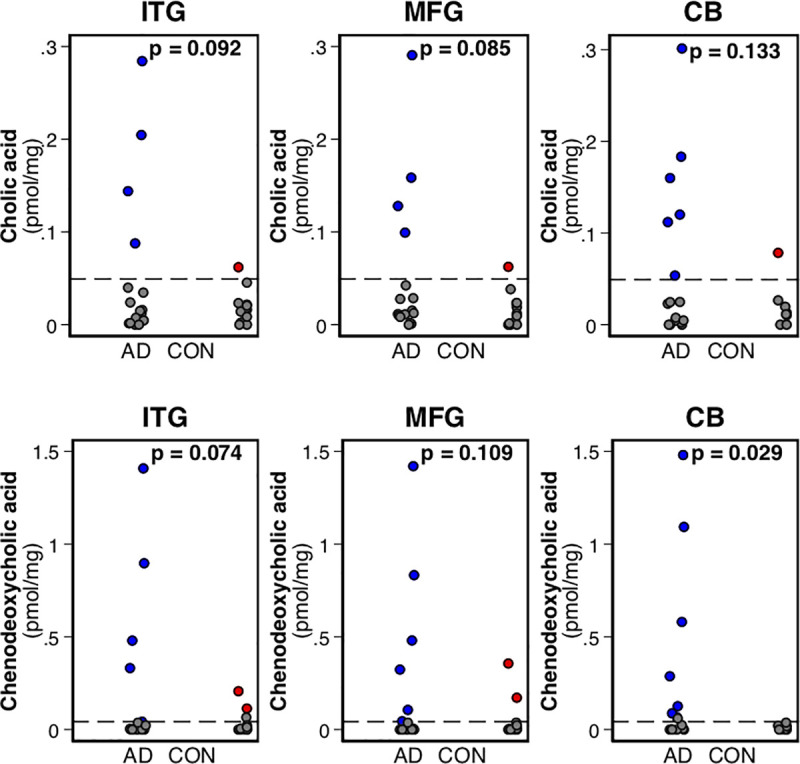
Fig 3. Differences in brain primary BA concentrations between AD and CON.

Dots in gray indicate concentrations below the LOD; dots in blue and red indicate AD and CON brain tissue sample metabolite concentrations, respectively. p-Values indicate differences between AD and CON from a tobit regression model; the lower limit in the model is set at the metabolite-specific LOD (indicated by the dashed line). The p-value for CDCA in the CB is derived from a chi-squared test because there were no detectable concentrations above the LOD in the CON sample. AD, Alzheimer disease; BA, bile acid; CB, cerebellum; CDCA, chenodeoxycholic acid; CON, control; ITG, inferior temporal gyrus; LOD, limit of detection; MFG, middle frontal gyrus.
