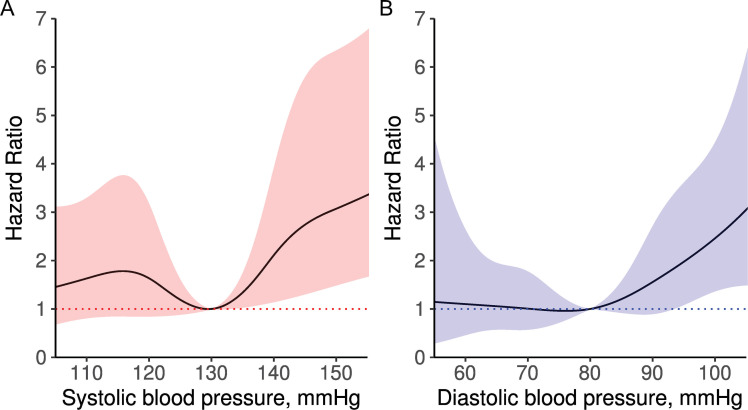
Fig 3. Spline curves of the association between blood pressure and risk of primary outcome.
Hazard ratio and 95% confidence interval for (A) SBP and (B) DBP are presented with solid lines and shaded areas. The data are derived from time-dependent Cox proportional hazard regression model for primary outcome using the method of restricted cubic splines with knots at 110, 120, 130, 140, and 150 mmHg of SBP and at 60, 70, 80, 90, and 100 mmHg of DBP. The reference is SBP 130 mmHg and DBP 80 mmHg. DBP, diastolic blood pressure; SBP, systolic blood pressure.

