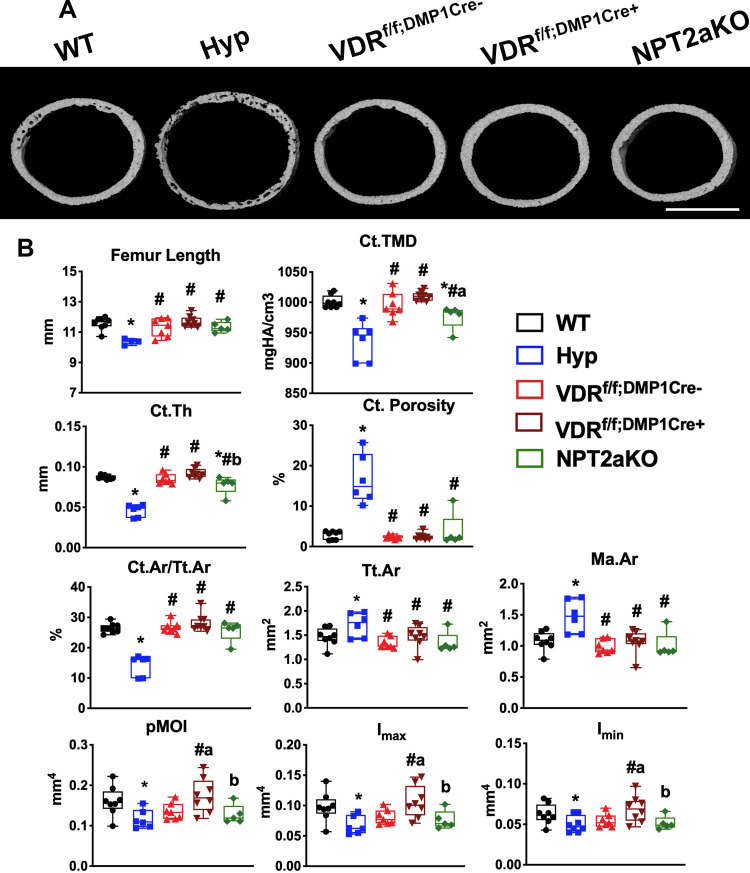
Fig 3. VDRf/f;DMP1Cre+ and NPT2aKO mice do not have significantly altered cortical microarchitecture.
MicroCT was performed on d30 femurs isolated from WT, Hyp, VDRf/f;DMP1Cre-, VDRf/f;DMP1Cre+ and NPT2aKO mice. (A) Representative images of microCT scans are shown. Scale bar = 0.5 mm. (B) Cortical microCT parameters (Femur length, cortical tissue mineral density (Ct.TMD), cortical thickness (Ct.Th), cortical porosity (Ct.porosity), cortical area fraction (Ct.Ar/Tt.Ar), total area (Tt.Ar), medullary area (Ma.Ar), and polar moments of inertia (pMOI, Imax, Imin)) are shown. Data are representative of that obtained from at least 5 mice per genotype, with NPT2aKO mice including 2–3 mice of either sex and all other groups including 3–4 mice of either sex. * p<0.05 vs WT, # p<0.05 vs Hyp, a p<0.05 vs VDRf/f;DMP1Cre-, b p<0.05 vs VDRf/f;DMP1Cre+.

