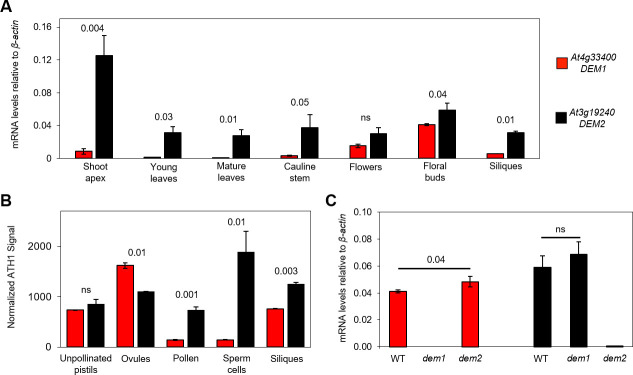
Fig 2. DEM1 and DEM2 mRNA levels in various tissues and sperm cells during vegetative and reproductive development.
(A) Quantitative real-time reverse transcriptase PCR (qRT-PCR) was used to examine DEM1 and DEM2 mRNA levels in total RNA extracted from a range of Arabidopsis tissues. Ratios of mRNA levels to that of β-actin mRNA are shown (average ± S.E. for three biological replicates). (B) Microarray-based expression analysis of DEM1 and DEM2 in Arabidopsis reproductive tissues and FACS-purified sperm cells. The figure is based on raw data published by Pina et al. [18], Borges et al. [19] and Boavida et al. [20], and shows mean signal intensities ± S.E. from ATH1 Genechips normalized by the invariant set method, as previously described [19]. Data were derived from two biological replicates for siliques [18], microdissected ovules and unpollinated pistils (UPs) [20], and three biological replicates for pollen and FACS-purified sperm cells [19]. (C) qRT-PCR analysis of DEM1 and DEM2 mRNA levels in total RNA extracted from Arabidopsis wild-type (WT), dem1-2 (dem1) and dem2-2 (dem2) floral buds. Ratios of mRNA levels to that of β-actin mRNA are shown (average ± S.E. for three to six biological replicates). P-values were calculated using one-way ANOVA to indicate significant differences between DEM1 and DEM2 expression in the different tissues and sperm cells of wild-type plants (A, B), or between floral buds of wild-type and dem plants (C).

