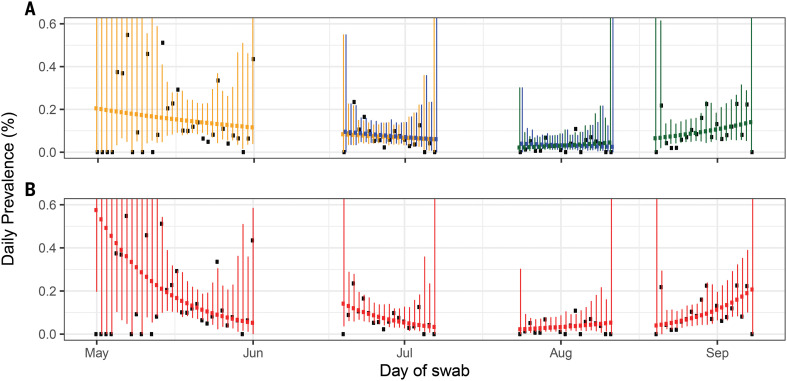
Fig. 1. Constant growth rate models fit to REACT-1 data for sequential and individual rounds.
(A) Model fits to REACT-1 data for sequential rounds 1 and 2 (yellow), 2 and 3 (blue), and 3 and 4 (green). Vertical lines show 95% prediction intervals for models. Black points show observations. See Table 1 for R estimates. (B) Models fit to individual rounds only (red). Note that only 585,004 of 596,965 tests had dates available and were included in the analysis (465 out of 473 positives were included).

