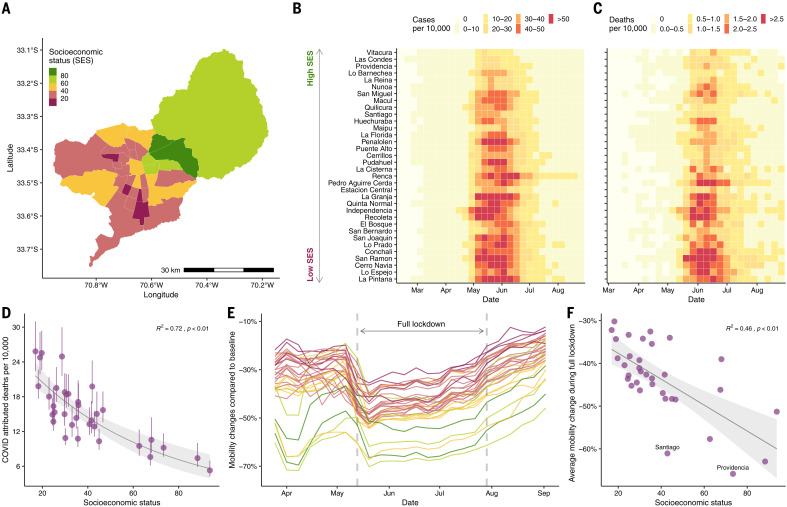
Fig. 1. SES, COVID-19 cases and deaths, and mobility data in Greater Santiago.
(A) Municipalities that are part of Greater Santiago are colored according to their SES, where a lower score is indicative of a lower SES. (B) COVID-19 cases normalized by population size per municipality. Municipalities are sorted by SES, starting with the one that has the highest SES at the top. (C) COVID-19–attributed deaths normalized by population size per municipality. (D) Age-adjusted COVID-19–attributed death rate and its association with SES. The dots and the whiskers represent the median and the 95% confidence intervals, respectively, reflecting uncertainty on the standard population used for weighting. R2, coefficient of determination. (E) Daily reduction in mobility by municipality colored by its SES value. (F) Average reduction in mobility during the full lockdown period and its association with SES. The urban and the business centers, Santiago and Providencia, respectively, experienced a greater reduction in mobility than expected based just on their socioeconomic profile. In (D) and (F), the shaded area indicates 95% regression confidence interval.

