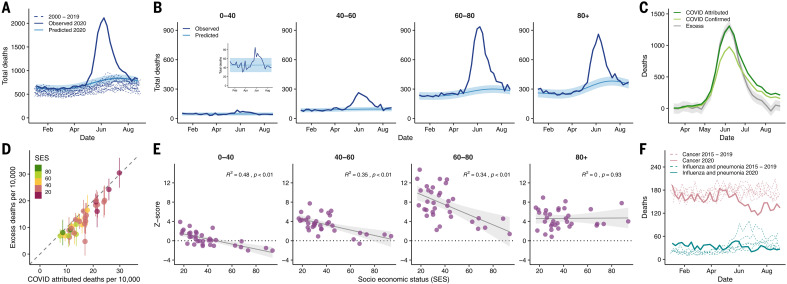
Fig. 3. Excess deaths and its association with demographic and socioeconomic factors.
(A) Observed deaths (solid dark blue line) in Greater Santiago compared with predicted deaths for 2020 (solid light blue line and its confidence intervals shaded in lighter color), using a Gaussian process regression model built with historical mortality data from 2000 to 2019 (dashed blue lines). The values contain all the possible causes of deaths. (B) Age-specific trends of the observed deaths compared with the predicted deaths for 2020. (C) COVID-19 deaths versus excess deaths. COVID-19–confirmed deaths are shown in light green, whereas COVID-19–attributed deaths are shown in dark green. Excess deaths correspond to the difference between observed and predicted deaths. (D) Comparison of excess deaths and COVID-19–attributed deaths per municipality colored by SES and normalized by population size. (E) Monthly average of z scores of observed deaths between April and July by age group. The z scores correspond to the standard deviations over expected values. (F) Historical deaths due to influenza and pneumonia (teal dashed lines) and cancer (pink dashed lines) compared with the observed deaths during 2020 (solid lines). In (B), (C), and (E), the shaded region indicates 95% regression confidence interval.

