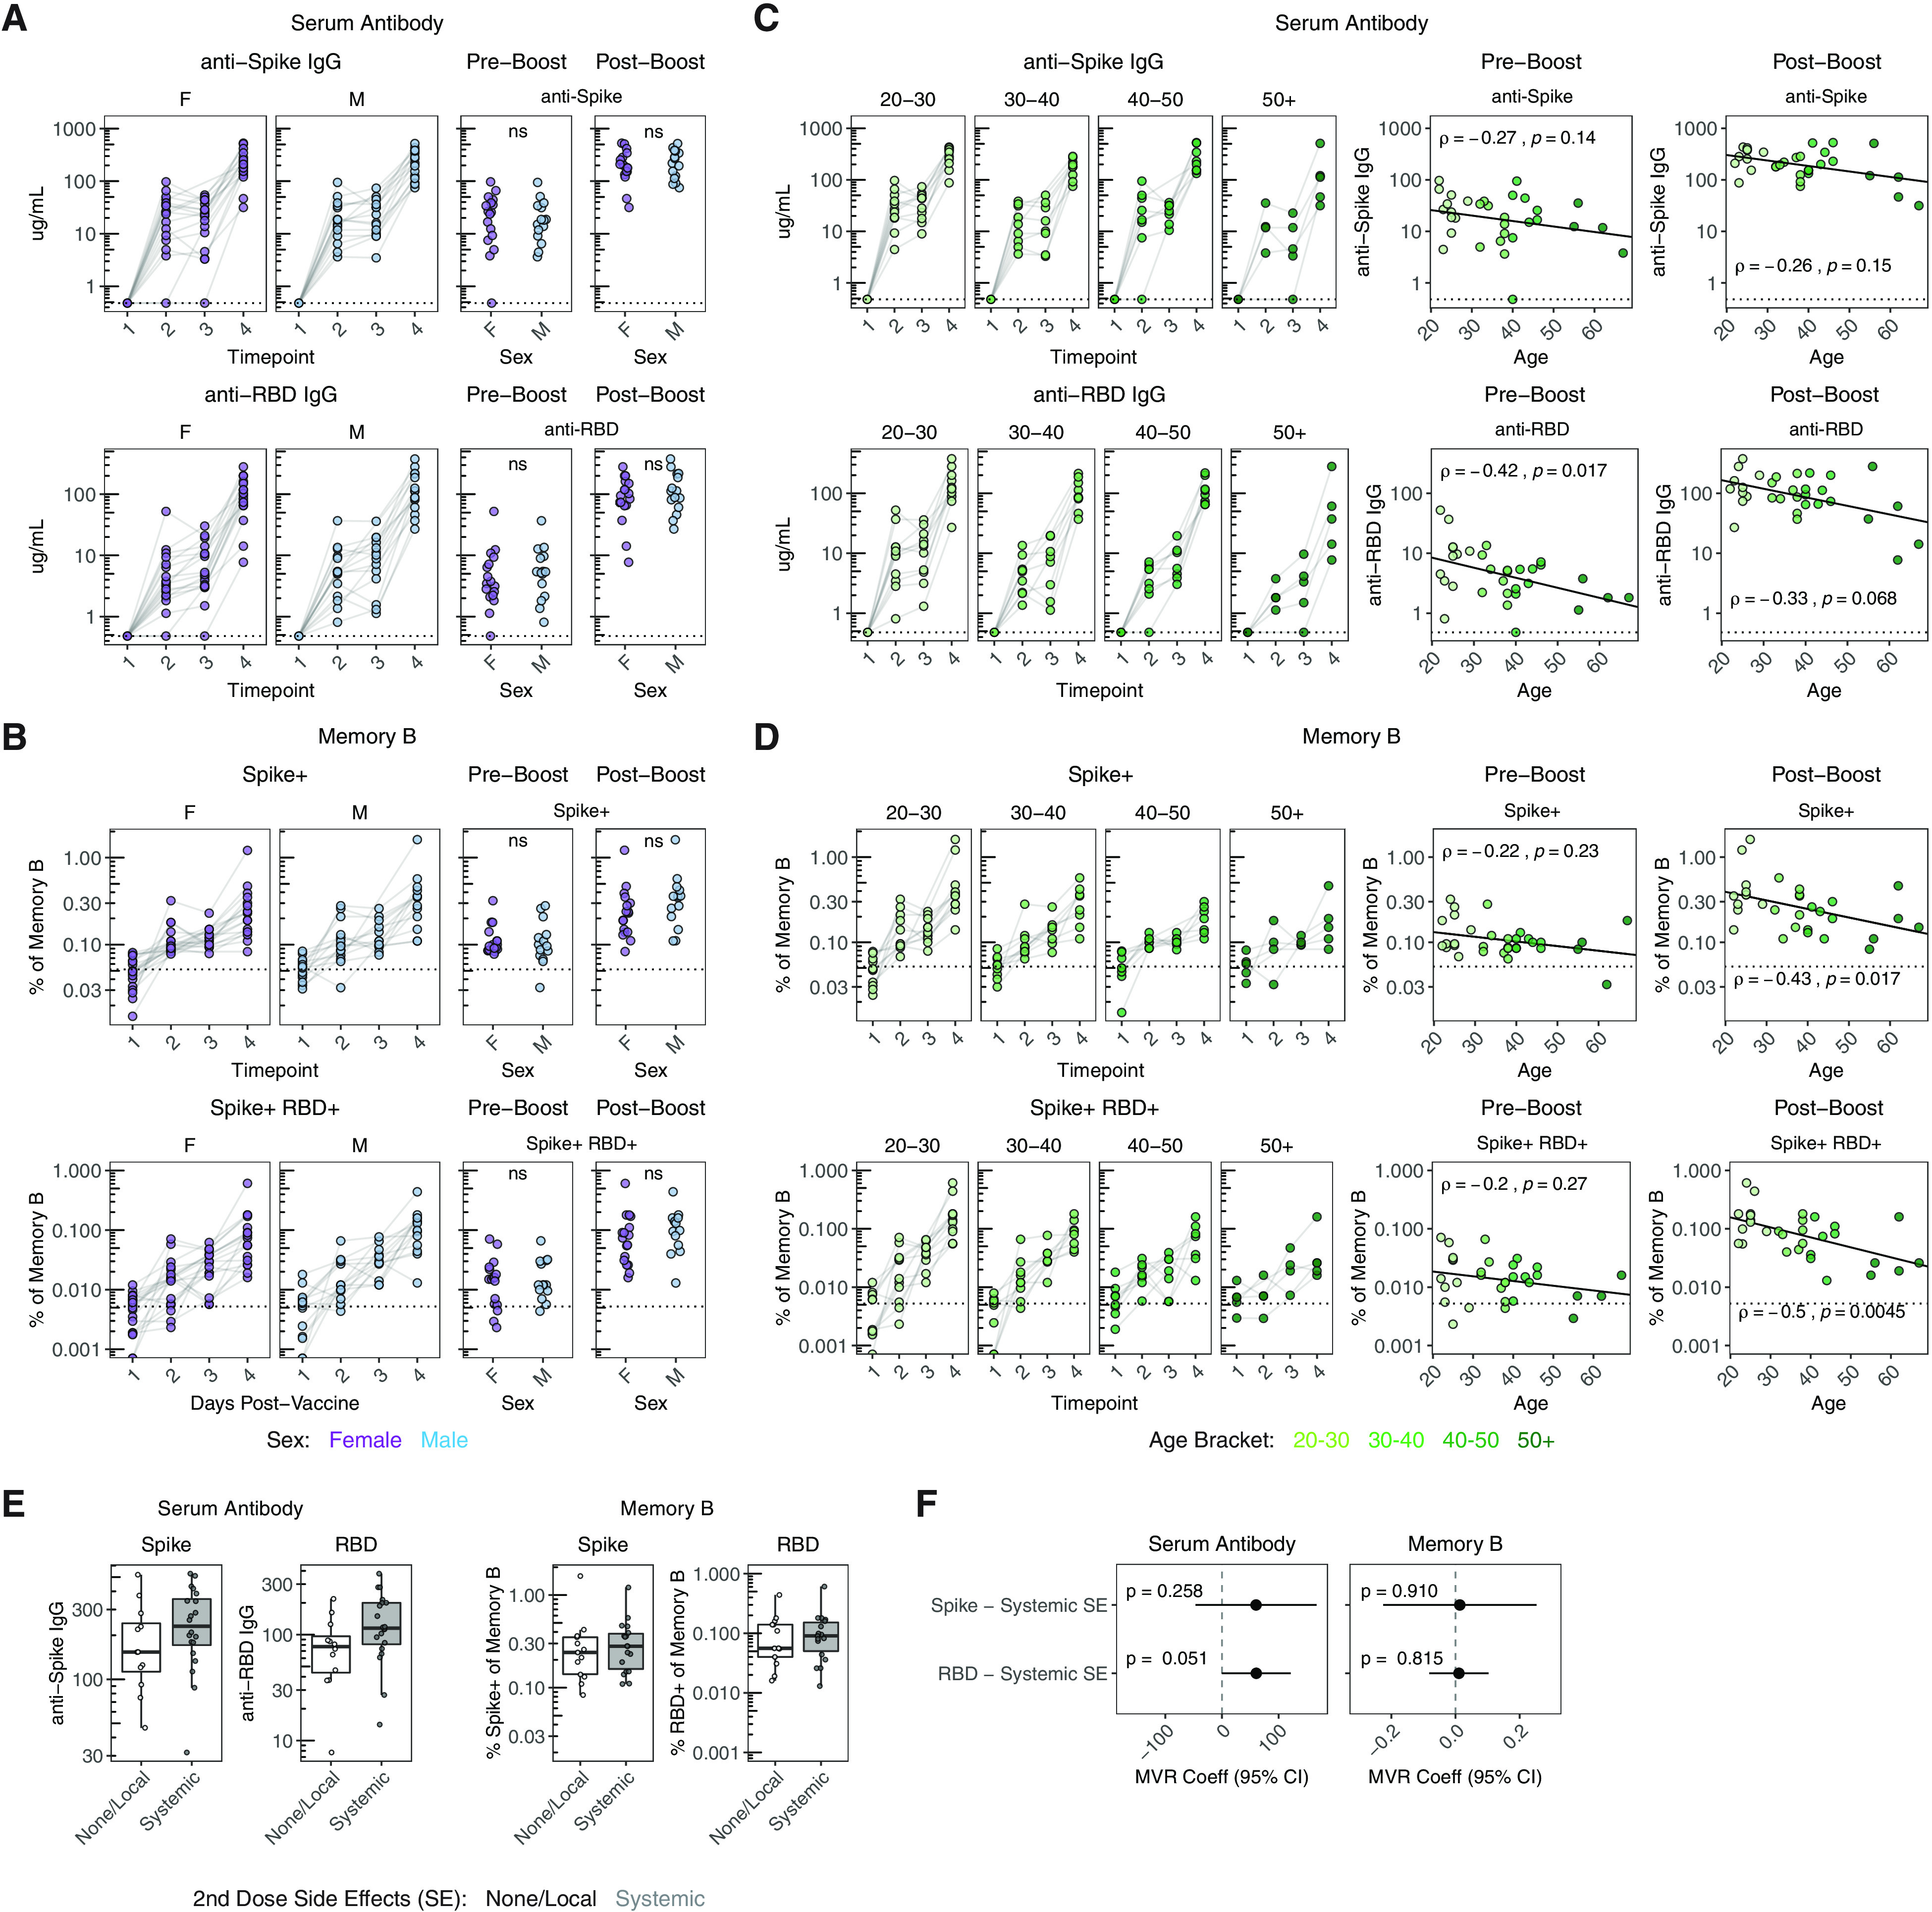
Fig. 3.

Association of age and side-effects with B cell responses following mRNA vaccination. A, C) Concentration of anti-spike and anti-RBD IgG antibodies over time compared with sex (A) and age (C) in SARS-CoV-2 naïve individuals. Dotted lines indicate the limit of detection for the assay. B, D) Frequency of spike+ and spike+/RBD+ memory B cells over time compared with sex (B) and age (D) in SARS-CoV-2 naïve individuals. Dotted lines indicate the mean frequency of cells at baseline. Pre-boost indicates samples collected at timepoint 2 (~15 days post-primary vaccination). Post-boost indicates samples collected at timepoint 4 (~7 days post-secondary vaccination). Statistics for sex were calculated using Wilcoxon test. Associations with age were calculated using Spearman rank correlation and are shown with linear trend lines. E) Concentration of anti-spike and anti-RBD IgG antibodies and frequency of spike+ and spike+/RBD+ memory B cells at the post-boost timepoint compared with self-reported side effects after the second dose. Reactogenicity was categorized into either no/local symptoms or systemic symptoms. F) Multivariable linear regression between antibody or memory B cell responses and side effects, controlling for sex and age. Data are represented as estimated regression coefficients with a 95% confidence interval.
