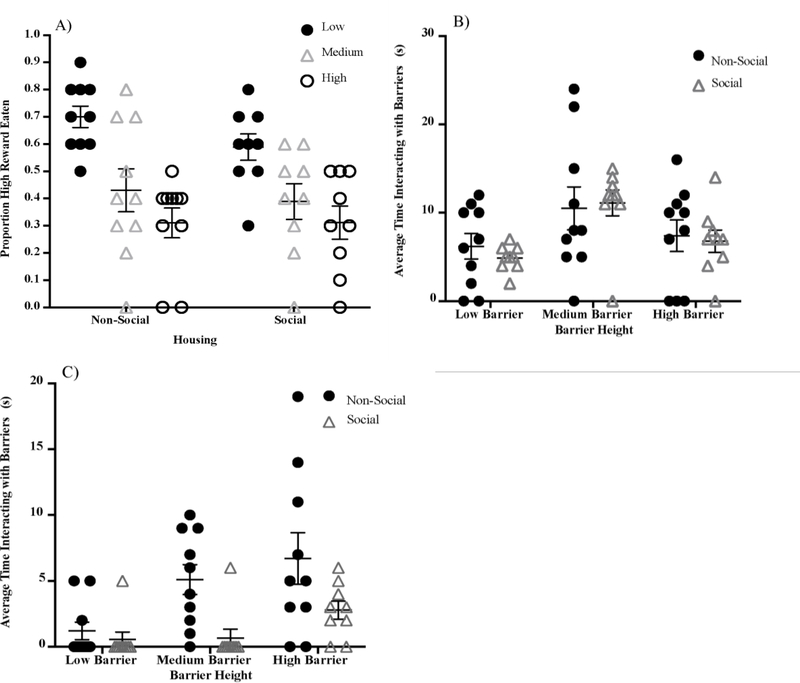
Figure 3.
(A) Test performance (proportion high reward obtained) as a function of barrier height and social housing condition. Average time spent interacting with the barriers (in seconds) for (B) adaptive perseverative trials and (C) maladaptive perseverative trials in obtaining the high reward for nonsocially-housed rats and socially-housed rats. Each data point represents an individual rat; horizontal lines represent group averages; error bars represent standard errors of the mean. Asterisk denotes a statistically significant group difference (p < .05).

