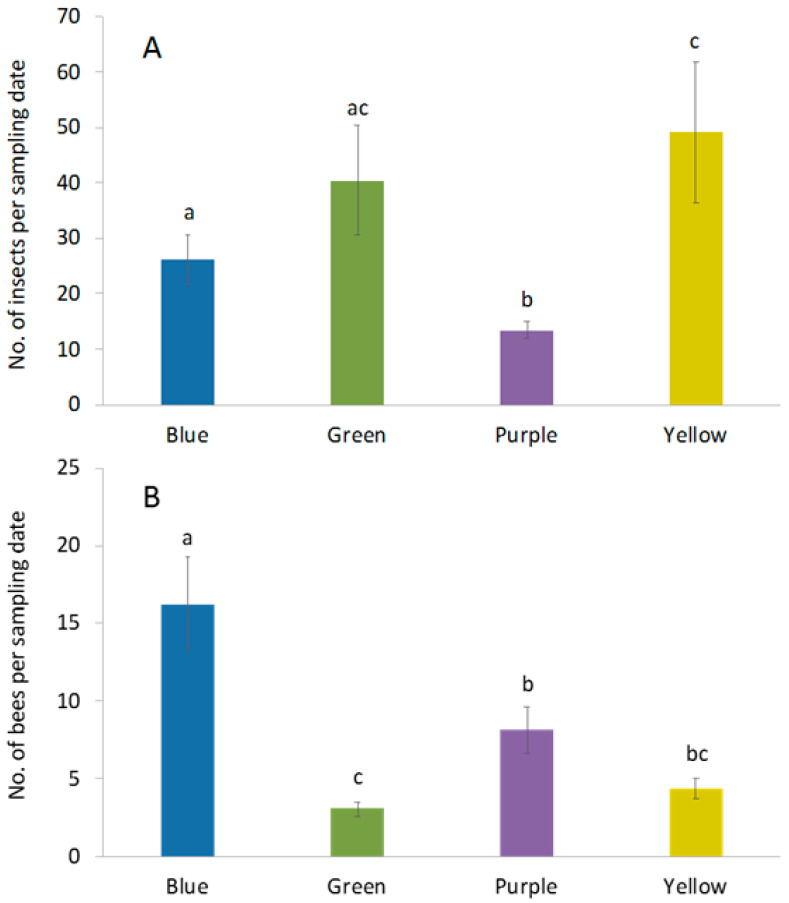
Figure 2.
Differences in capture rate (±SE) of (A) total insects and (B) bees among four pan trap colors in livestock pastures. There were four trap color in each of the 4 plots. Samples were taken 4 times each week for 8 wk. Different lowercase letters indicate significant differences among trap colors (p < 0.05).

