Figure 1.
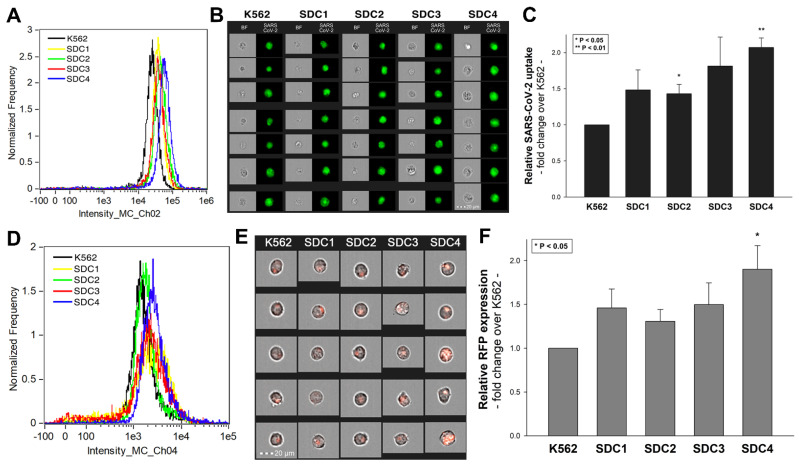
Cellular entry of SARS-CoV-2 into SDC transfectants. WT K562 cells and SDC transfectants were incubated with heat-inactivated SARS-CoV-2 (at 1 MOI) for 18 h at 37 °C. After incubation, the cells were washed, trypsinized, fixed, permeabilized and treated with antibodies specific for the spike glycoprotein (along with secondary AF 488-labeled antibodies). Cellular uptake of SARS-CoV-2 was then analyzed with imaging flow cytometry and confocal microscopy. (A) Representative flow cytometry histograms showing the intracellular fluorescence of SARS-CoV-2-treated WT K562 cells and SDC transfectants. (B) Brightfield (BF) and fluorescent cellular images of SARS-CoV-2-treated WT K562 cells and SDC transfectants. Scale bar = 20 μm. (C) Detected fluorescence intensities were normalized to SARS-CoV-2-treated WT K562 cells as standards. The bars represent the mean ± SEM of four independent experiments. Statistical significance vs. standards was assessed with analysis of variance (ANOVA). * p < 0.05; ** p < 0.01. (D–F) Contribution of SDCs to SARS-CoV-2 PSV-mediated gene transduction. WT K562 cells and stable SDC transfectants were incubated with 1 × 10⁵ transducing units of SARS-CoV-2 PSV-RFP. RFP expression was analyzed 72 h later with imaging flow cytometry. (D) Representative flow cytometry histograms showing RFP fluorescence of WT K562 cells and SDC transfectants, following 72 h incubation with SARS-CoV-2 PSV. (E) Cellular images of SARS-CoV-2 PSV-treated WT K562 cells and SDC transfectants as detected with imaging flow cytometry. Scale bar = 20 μm. (F) Detected cellular RFP intensities were normalized to SARS-CoV-2 PSV-treated WT K562 cells as standards. The bars represent the mean ± SEM of four independent experiments. Statistical significance vs. standards was assessed with ANOVA. * p < 0.05.

