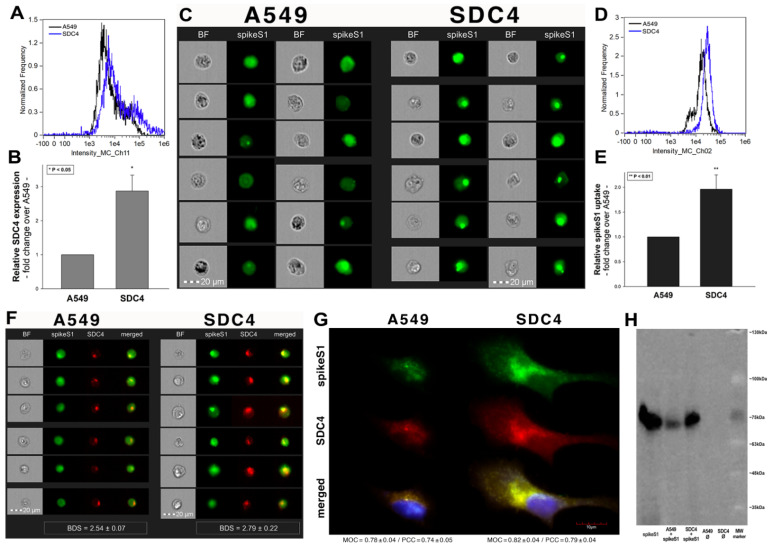
Figure 8.
SDC4 overexpression increases spikeS1 uptake in A549 cells. WT A549 cells and SDC4 transfectants (created in A549 cells) were incubated with recombinant spikeS1 for 18 h at 37 °C. After incubation, spikeS1-treated cells were trypsinized, fixed, permeabilized and treated with fluorescently labeled anti-His tag antibodies. After antibody treatment, intracellular fluorescence was analyzed with either imaging flow cytometry or confocal microscopy. (A,B) SDC4 expression measured with flow cytometry by using APC-labeled SDC4 antibodies. (A) Representative flow cytometry histograms showing SDC4 expression levels of WT A549 cells and SDC4 transfectants. (B) Detected SDC4 expression levels were normalized to those of WT A549 cells as standards. The bars represent the mean ± SEM of three independent experiments. Statistical significance vs. standards was assessed with ANOVA. * p < 0.05. (C) Cellular images representing intracellular fluorescence of spikeS1-treated WT A549 cells and SDC4 transfectants. (D,E) SDC4 overexpression increases spikeS1 uptake. (D) Representative flow cytometry histograms showing the intracellular fluorescence of spikeS1-treated WT A549 cells and SDC4 transfectants. (E) Fold change in spikeS1 uptake following SDC4 overexpression. The bars represent the mean ± SEM of three independent experiments. Statistical significance vs. spikeS1-treated WT A549 cells as standards was assessed with ANOVA. ** p < 0.01. (F) Colocalization of spikeS1 in WT A549 cells and SDC4 transfectants as detected with imaging flow cytometry. The indicated BDS between spikeS1 and SDC4 represents the mean ± SEM of three independent experiments. (G) Confocal microscopy visualization of colocalization between spikeS1 and SDC4 in WT A549 cells and SDC4 transfectants. Representative images of three independent experiments are shown. Scale bar = 10 μm. The MOC ± SEM and PCC ± SEM for the overlap and colocalization of SDC4 with spikeS1 are indicated in the images. The MOC and PCC values were calculated by analyzing 12 images with an average of 12 cells in each image (from 3 separate samples). (H) A representative Western blot showing spikeS1 immunoprecipitated with SDC4 in WT A549 cells and SDC4 transfectants. Lane 1: 0.5 µg of spikeS1; lanes 2–3: immunoprecipitates of spikeS1-treated WT A549 cells and SDC4 transfectants, respectively; lanes 4–5: immunoprecipitate of WT A549 cells and SDC4 transfectants untreated with spikeS1 (controls). Standard protein size markers are indicated on the right.

