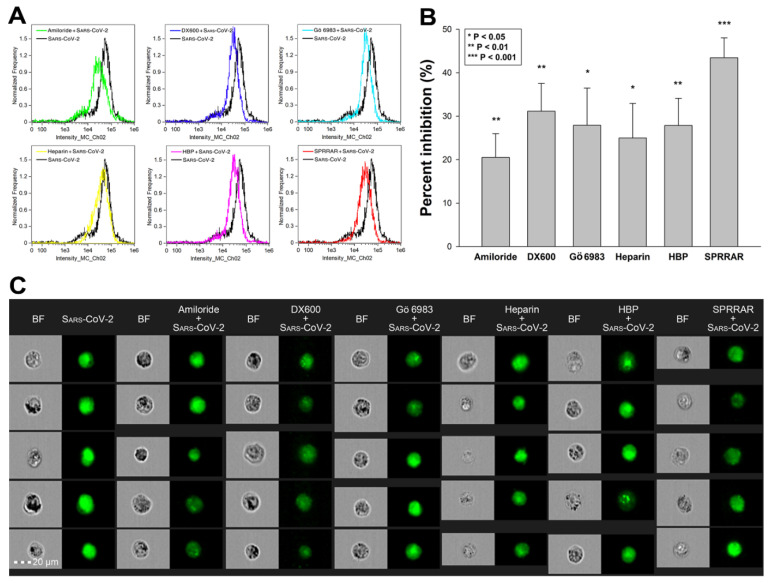
Figure 9.
Effects of ACE2 or SDC4 inhibition on SARS-CoV-2 uptake in A549 cells. (A) Cellular images of SARS-CoV-2-treated WT A549 cells preincubated with or without either of the inhibitors: amiloride, DX600, Gö 6983, heparin, HBP and SPRRAR. After 18 h of incubation, the cells were washed, trypsinized, fixed, permeabilized and treated with antibodies specific for the spike glycoprotein (along with AF 488-labeled secondary antibody). Intracellular fluorescence was then analyzed with imaging flow cytometry. (B) Flow cytometry histograms representing intracellular fluorescence of SARS-CoV-2-treated WT A549 cells preincubated with or without any inhibitors. (C) The effect of an inhibitor was expressed as percent inhibition, calculated with the following formula: [(X − Y)/X] × 100, where X is the fluorescence intensity obtained on cells treated with SARS-CoV-2 in the absence of the inhibitor, and Y is the fluorescence intensity obtained on cells treated with SARS-CoV-2 in the presence of the inhibitor. The bars represent the mean ± SEM of four independent experiments. Statistical significance vs. controls treated with SARS-CoV-2 in the absence of the inhibitor was assessed with ANOVA. * p < 0.05; ** p < 0.01; *** p < 0.001.

