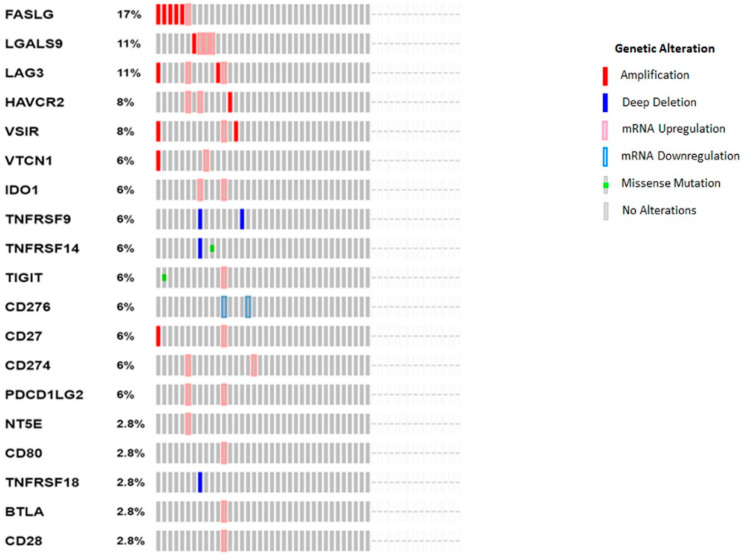
Figure 1.
The OncoPrint analyses of CCA patients reveal changes in expression of ICs. Rows and columns represent genes and CCA patients, respectively. Genetic alterations, such as copy number alterations (homozygous deletions and amplifications), mutations and gene expression changes, are represented by glyphs and color codes. The patient order is presented as per alterations.

