. 2020 Apr 14;11(18):4608–4617. doi: 10.1039/d0sc00512f

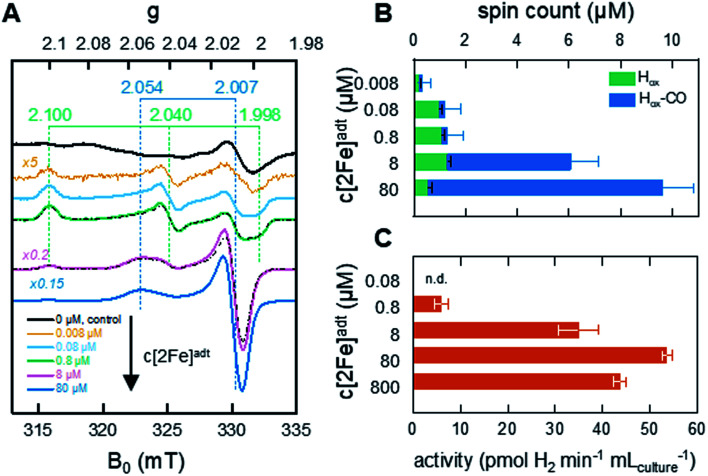
Fig. 2. In vivo H-cluster assembly monitored by EPR spectroscopy and H2 gas production. (A) Whole-cell EPR spectra of apo-HydA1 (control, 0 μM [2Fe]adt added) and [2Fe]adt-HydA1 containing cell suspensions, concentrated to 400 μL. H-cluster assembly occurs spontaneously upon addition of [2Fe]adt to the medium, with Hox being the favored state at low [2Fe]adt concentrations. As the concentration of the synthetic cofactor increases, the cell samples become dominated by the Hox–CO state. The g-values of Hox (green dashed lines) and Hox–CO (blue dashed lines) states are based on simulations of the two samples at 0.8 and 8 μM (black dash-dotted lines). All [2Fe]adt-HydA1 spectra were corrected for contribution from the cells by subtracting the signal of the apo-HydA1 control sample (black spectrum). EPR experimental conditions: T = 20 K, P = 1 mW, ν = 9.28 GHz. (B) Concentrations of the Hox (green bars) and Hox–CO (blue bars) signals in each sample, extrapolated from the simulations. The full length of the bar reflects total spin count. Error bars indicate estimated relative error from simulations, in addition an absolute error of approx. 0.5 μM is expected from the background subtraction (see Fig. S1 for details). (C) Average rate of hydrogen gas production during 1 h from anaerobic 2 mL E. coli cultures, concentrated from 100 mL batch cultures.

Fig. 2