. 2020 Apr 14;11(18):4608–4617. doi: 10.1039/d0sc00512f

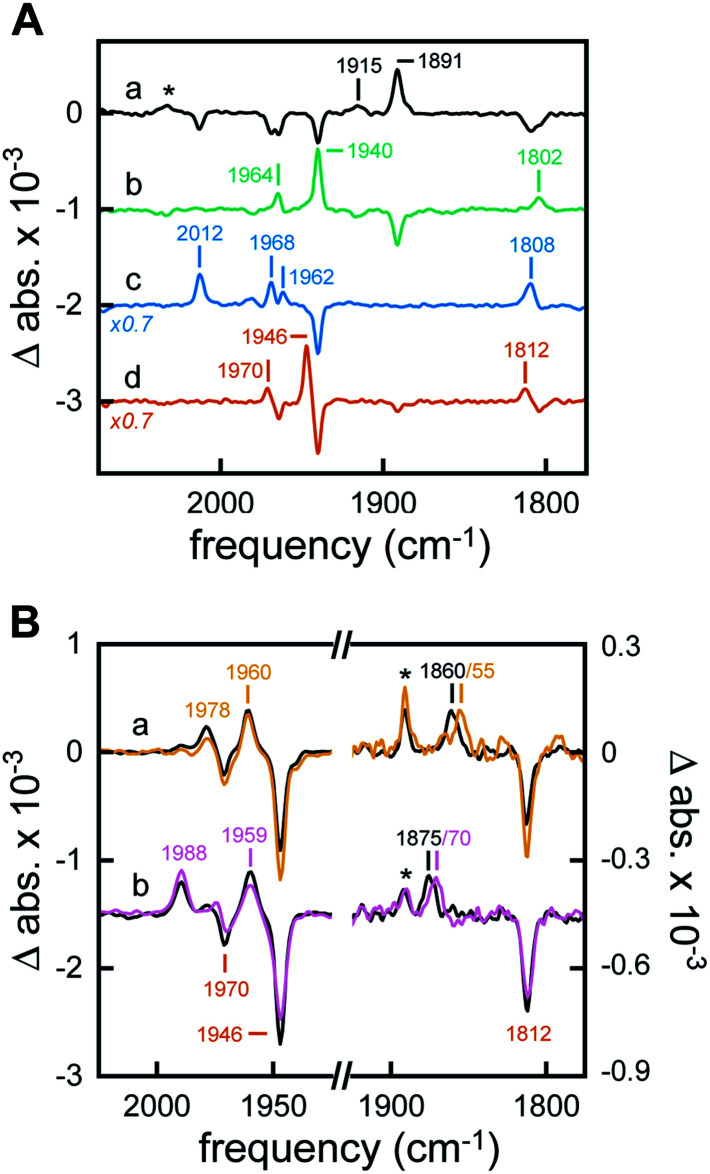
Fig. 4. ATR FTIR analysis of [2Fe]adt-HydA1 containing E. coli cells. All difference spectra show the CO regime of the H-cluster. (A) In the presence of 1% H2 (pH 8, 2 mM NaDT) freshly prepared cells converted from Hox and Hox–CO to Hred (spectrum a). * The band at 2032 cm−1 was attributed to a CN band of Hred. In the absence of H2 quantitative enrichment of Hox was observed (spectrum b). Exposure to 1% CO resulted in population of Hox–CO (spectrum c). Under non-reducing, acidic conditions (N2, pH 4, 2 mM NaDT) Hox converted into HoxH (spectrum d). (B) In the presence of 1% H2 (pH 4, 2 mM NaDT) formation of Hhyd over HoxH was observed (spectrum a, black line). Reduction with D2 gas reproduced the hydride-specific downshift of the μCO band from 1860 to 1855 cm−1 (spectrum a, dark yellow line). Increasing the NaDT in the aerosol to 100 mM (pH 4, 1% H2) facilitated accumulation of a new state, HhydH+ (spectrum b, black line). The downshift of the μCO band under D2 (1875 to 1870 cm−1) verified the presence of a hydride ligand (spectrum b, purple line). * Small fraction of Hred at low pH.

Fig. 4