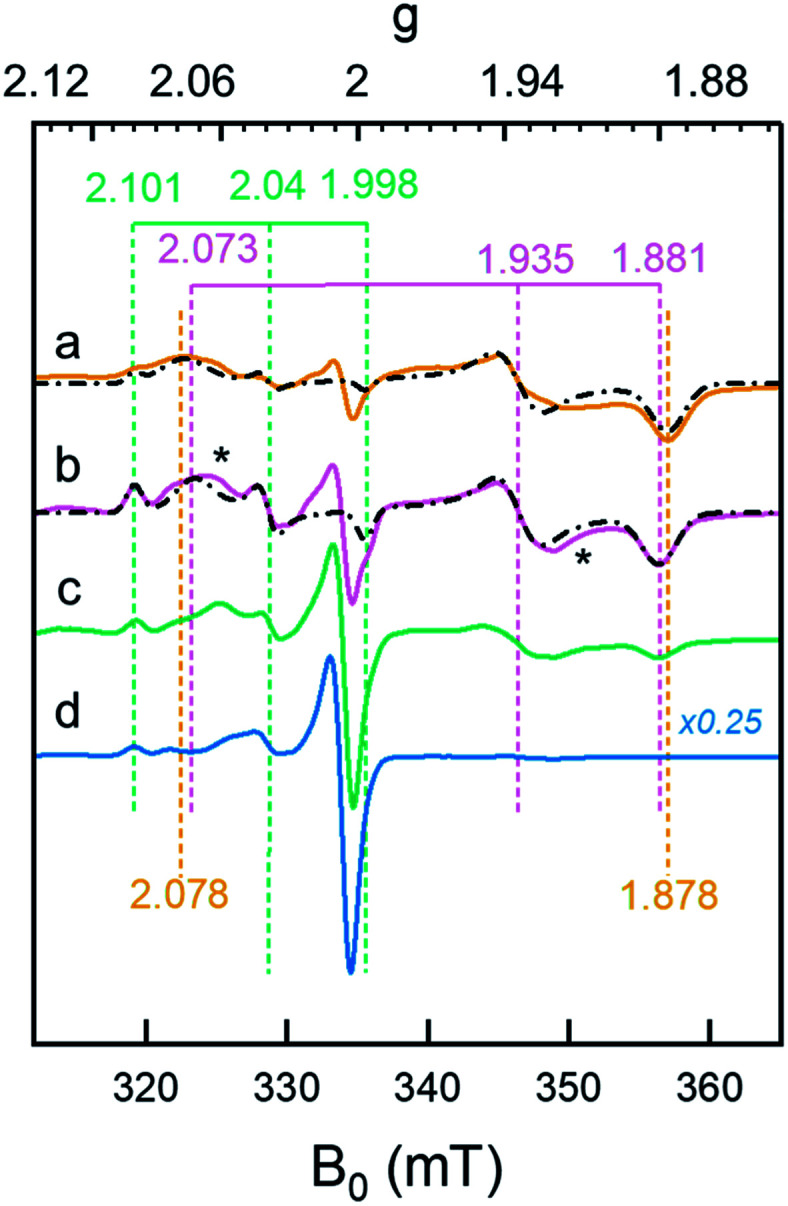
Fig. 5. Whole-cell generation of the Hhyd and HhydH+ states under different conditions probed by EPR spectroscopy. (a) The Hhyd state was observable in EPR spectra recorded on [2Fe]adt-HydA1 containing cells at pH 7.5, complemented with 10 mM NaDT, flushed with H2 for 15 min and rapidly frozen (dark yellow spectrum); (b): A new signal attributed to HhydH+ was observed in samples prepared as lane a but at pH 4 (purple spectrum); (c) samples prepared as lane b but excluding NaDT generated a weaker HhydH+ signal (green spectrum); (d) samples prepared as lane b but excluding H2 flushing did not generate any discernable HhydH+ signal (blue spectrum). The g-values of Hox/HoxH (green dashed vertical lines), Hhyd (dark yellow dashed vertical lines) and HhydH+ (purple dashed vertical lines) states are based on the simulations of the spectra (black dash-dotted lines), for details see Fig. S13.† Unassigned weak signals potentially arising from an Htrans-like state indicated with asterisks.40 EPR experimental conditions: T = 20 K, P = 1 mW, ν = 9.38 GHz.

