. 2020 Apr 29;11(19):4991–4998. doi: 10.1039/d0sc01517b

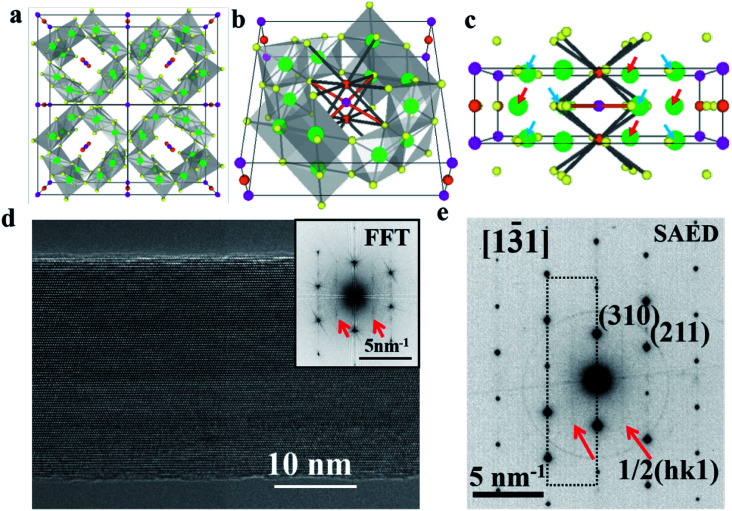
Fig. 1. Structure and microscopy observations of the cryptomelane nanorod. Perspective view of the cryptomelane atomic models from the (a) [001], (b) [104], and (c) [100] projection. Orange, purple, green, and yellow spheres represent K+ at 2b, K+ at 2a, Mn, and O, respectively. The thin black rectangle outlines the unit cell. Thick grey and orange lines in (b) and (c) outline the K+ (2b)–O2− and K+ (2a)–O2− bond, respectively. K+ (2b) bonds with 8 surrounding O2− with a bond length of 2.91 Å, while K+ (2a) forms bonds with 4 surrounding O2− with a bonding length of 2.56 Å. The red and blue arrows highlight Mn atoms adjacent to K+ (2b) and K+ (2a), respectively. (d) Typical high-resolution TEM image of a cryptomelane nanorod from the [13̄1] zone axis. The corresponding FFT result is also shown in the inset. (e) Selected area electron diffraction pattern acquired from the same nanorod, which shares a similar streaking feature with the FFT result in (d) due to the 2c ordering. Streaks at 1/2c are indicated by red arrows.

Fig. 1