. 2020 Apr 29;11(19):4991–4998. doi: 10.1039/d0sc01517b

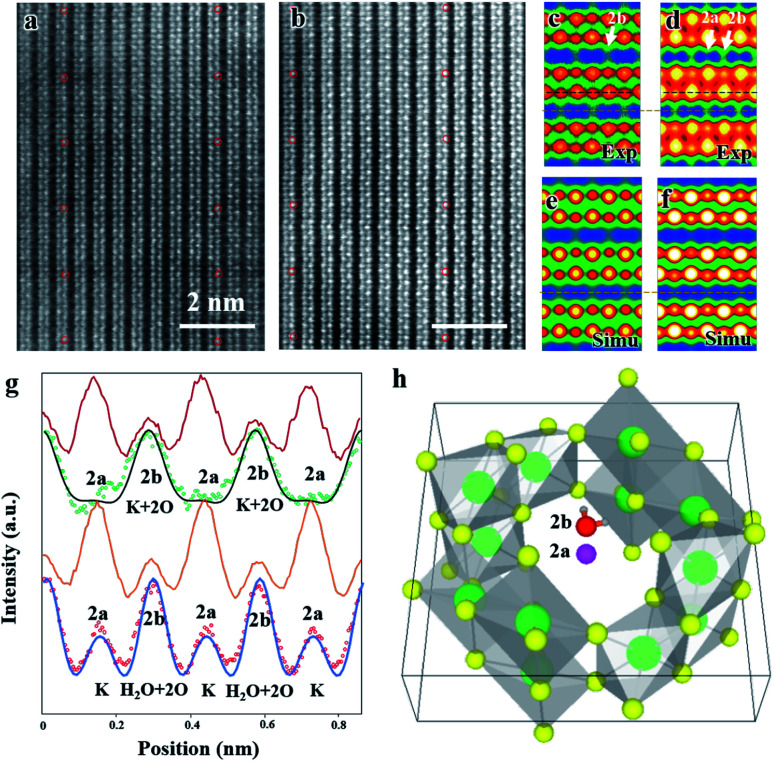
Fig. 2. Comparison of dry and hydrated cryptomelane nanorods from the in-plane direction. (a) Typical HAADF image of a cryptomelane nanorod. (b) HAADF image for hydrated cryptomelane. Both images were recorded along the [100] direction. (c) and (d) Averaged images over 5 units in (a) and (b), as marked by red circles in (a) and (b). The averaged images are rotated 90° with respect to the original STEM images. The images are shown in false color with intensity values indicated by the blue-green-red-yellow-white color map in an ascending order. (e) and (f) Simulated images of the structural model with thicknesses of (e) 32 nm and (f) 42 nm. In (e), 0.4 K+ ions occupy 2b sites. In (f), 0.7 H2O molecules occupy 2b sites, 0.2 K+ ions occupy 2b sites and 0.2 K+ ions occupy 2a sites, respectively. (g) Intensity profiles of horizontal scan lines shown in (c)–(f). The dark-red and orange lines are from the Mn column (black horizontal lines in (c) and (d)), while the green and red dots are from the tunnels (orange lines in (c) and (d)). The black and blue lines are the calculated intensities of (e) and (f). The intensity is normalized for clarity. (h) An atomic model showing water located at the 2b site, with K+ at the 2a site.

Fig. 2