. 2020 Apr 29;11(19):4991–4998. doi: 10.1039/d0sc01517b

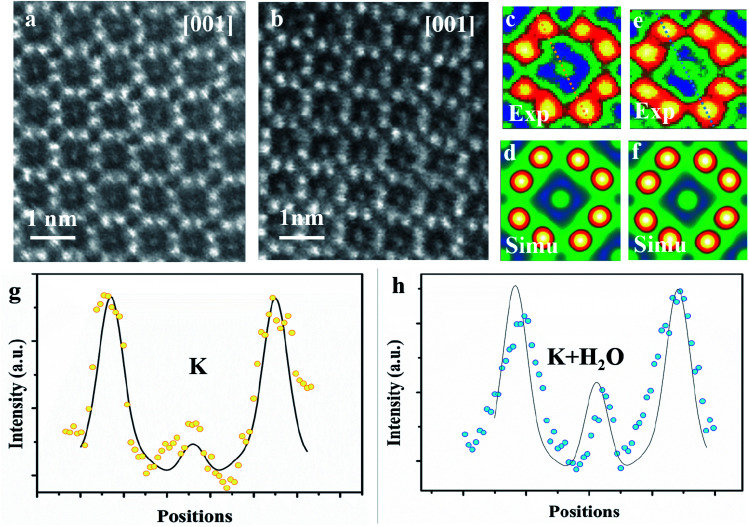
Fig. 3. High resolution HAADF-STEM images for hydrated and dry potassium cryptomelane nanorods viewed along the [001] zone axis. (a) High resolution experimental image of a typical microtome-prepared dry cryptomelane sample. All the tunnels are well-aligned and occupied. (b) The high-resolution image from the hydrated sample. (c) Averaged image from (a). (d) Simulated HAADF-STEM image for the K0.80Mn8O16 unit cell with 80 nm thickness. (e) Averaged image from (b). (f) Simulated image for K0.80Mn8O16·(1.40)H2O with 80 nm thickness along the [001] direction. (g) Yellow dots and the solid black line are intensity profiles for experimental and simulation results at the same position (i.e. dashed yellow line area in (c)), respectively. (h) Intensity profiles for the same area (i.e. blue dashed line area in (e)). The simulated relative intensity matches well with the experimental results.

Fig. 3