. 2020 Apr 29;11(19):4991–4998. doi: 10.1039/d0sc01517b

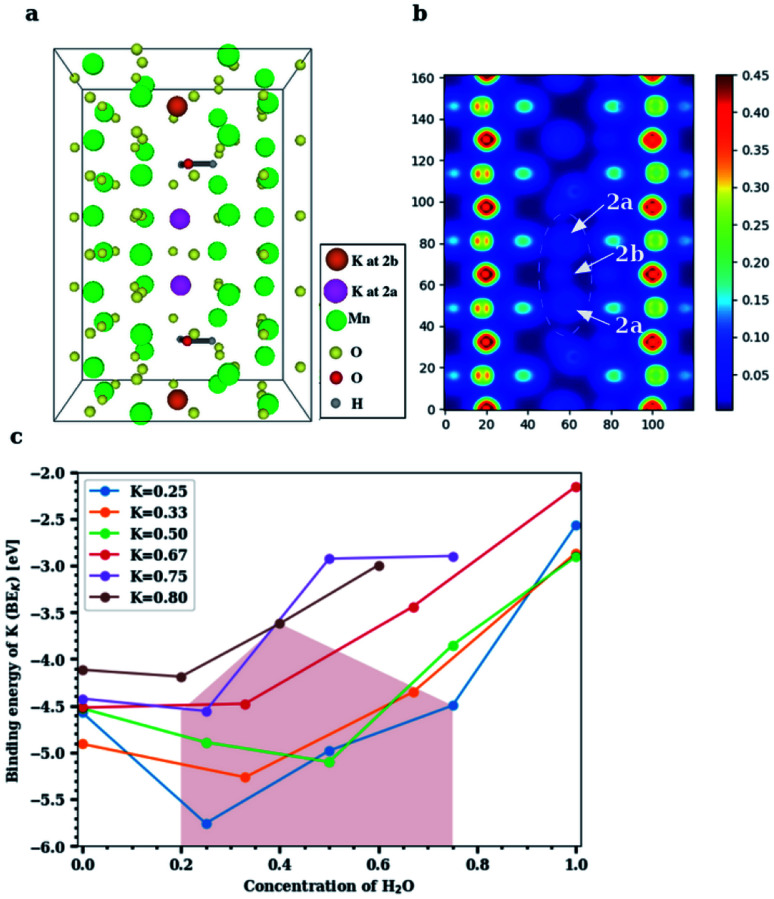
Fig. 4. Results from DFT simulations of hydrated cryptomelane. (a) K0.80Mn8O16·(0.40)H2O: four K+ and two H2O in five unit cells of α-Mn8O16 in a single tunnel, shown along the a-axis. The two outer K+ ions occupy ‘2b’ sites; the two inner K+ ions are displaced by H2O molecules to ‘2a’ sites. One H2O solvates two K+ ions – one above and one below. (b) Mean charge density plot for K0.80Mn8O16·(0.40)H2O from the [100] axis, showing the displacement of K+ ions from ‘2b’ to ‘2a’ sites by H2O molecules inside the tunnel. The tunnel-centered sites corresponding to red-colored charge densities are ‘2b’ sites, while those corresponding to yellow densities are ‘2a’ sites. (c) Binding energy of K+ at varying concentrations of H2O for KxMn8O16·yH2O. The blue, orange and green curves indicate low-K+ concentrations; red, purple and brown indicate high-K+ concentrations in the tunnel. Experimentally realized concentrations are closest to the brown curve.

Fig. 4