. 2020 Apr 29;11(19):4991–4998. doi: 10.1039/d0sc01517b

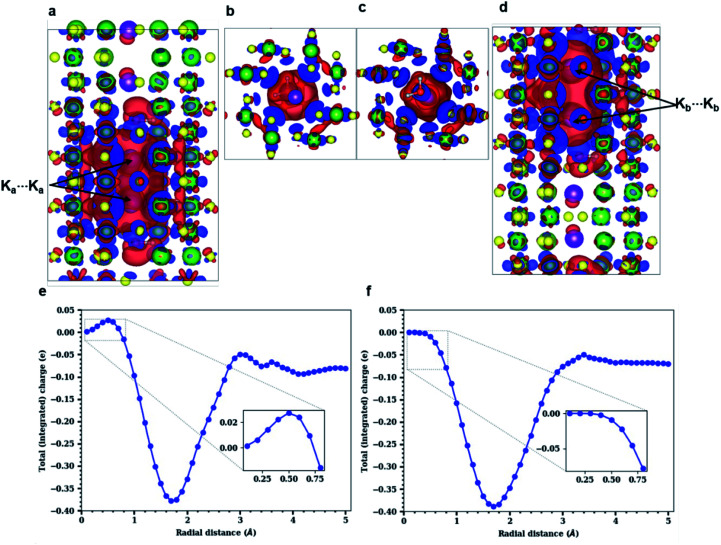
Fig. 5. Charge distribution around K⋯K pairs shown by isosurfaces (cutoff = 0.001 e au−3) and integrated charge densities. (a)–(d) Blue regions indicate positive isosurface (electronic charge accumulation); red regions indicate negative isosurface (electronic charge depletion). The charge density of the Ka⋯Ka pair occupying ‘2a’ sites is shown along (a) a-, and (b) c-axes, and of the Kb⋯Kb pair occupying ‘2b’ sites is shown along (c) c-, and (d) a-axes. H2O separates and coordinates with the Ka⋯Ka and Kb⋯Kb pairs. Integrated charge computed for the (e) Ka⋯Ka pair, (f) Kb⋯Kb pair. The insets in (e) and (f) compare the charge behavior in Ka⋯Ka and Kb⋯Kb pairs.

Fig. 5