. 2020 Apr 22;11(19):4922–4933. doi: 10.1039/d0sc00554a

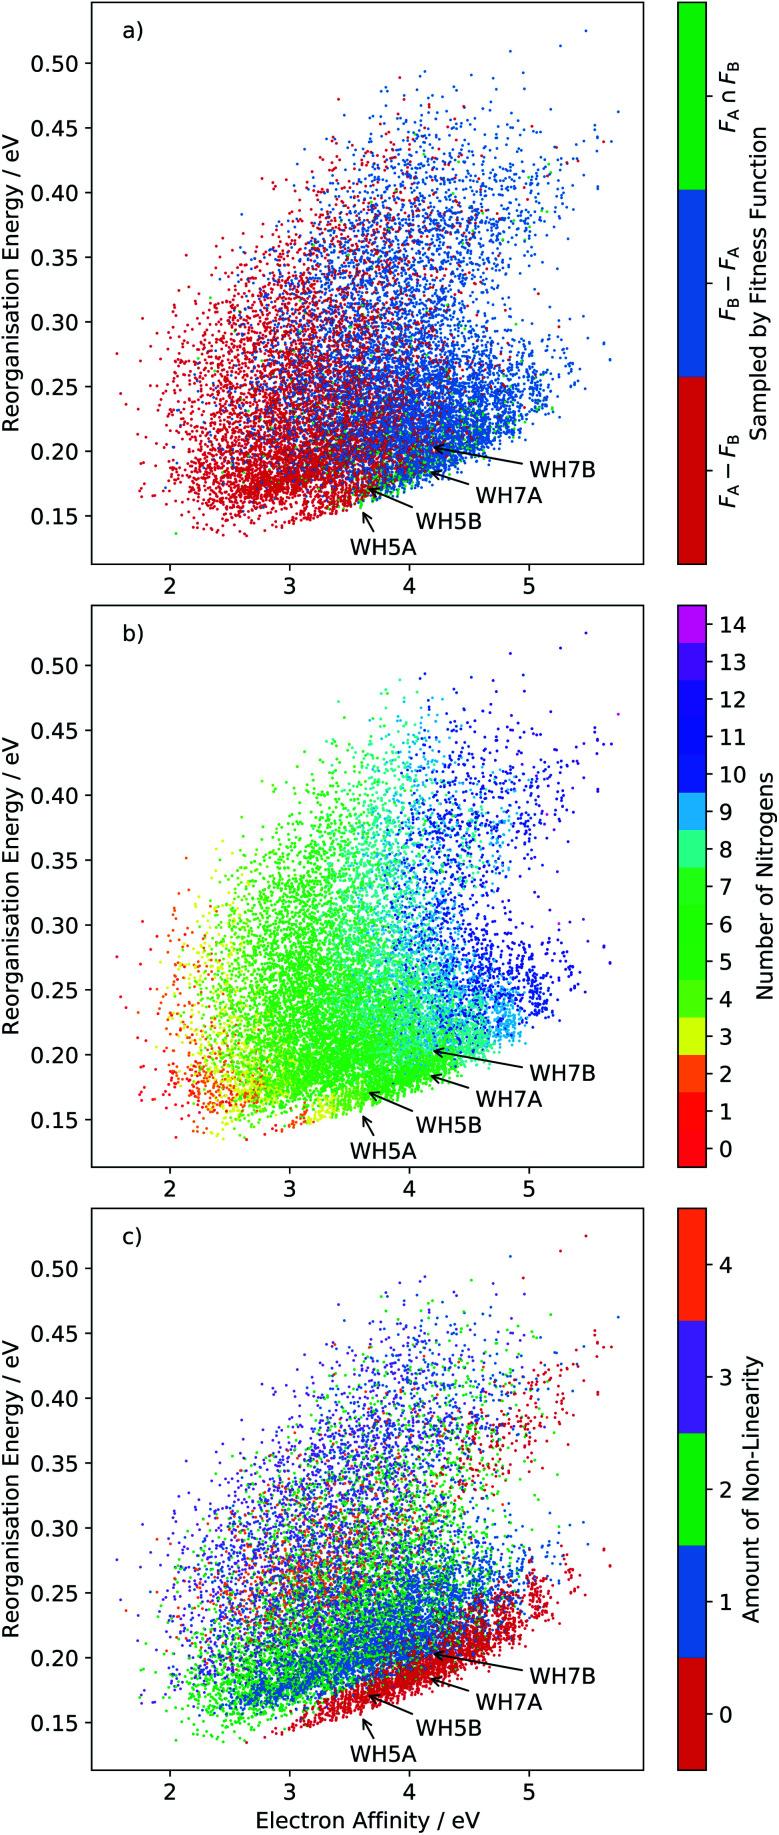
Fig. 6. Plots of the reorganisation energy and solid-state electron affinity for all molecules sampled across all 20 runs of the evolutionary algorithm, minimising fitness function FA (10 runs) and FB (10 runs). A total of 15 870 unique molecules (23.3% of the total chemical space) are sampled in this combined set of searches. Points are plotted with three different colour series: (a) molecule sampled by fitness function FA and not FB (FAFB), FB and not FA (FBFA) or FA and FB (FAFB); (b) colour coded by number of nitrogen atoms in the molecule and (c) by degree of non-linearity in the molecular structure (as defined in the ESI). Locations of four azapentacenes molecules proposed by Winkler and Houk15 (WH5AWH7B) are labelled on each plot.

Fig. 6