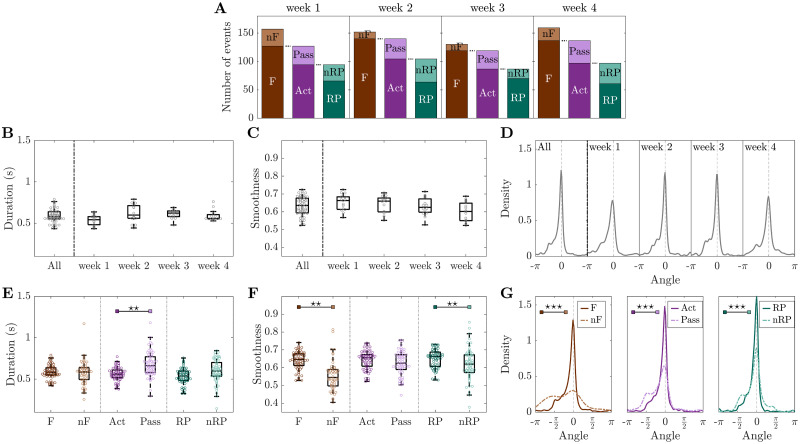
Fig 4. Cortical propagation features discriminate event types in healthy mice.
(A) Mean number of events per mouse per week, partitioned by type of event. (B-D) Duration, smoothness, and angles distribution are preserved over weeks. (E) Event duration is a marker for discriminating active (Act) and passive (Pass) events. (F) Smoothness discriminates force (F) and non-force (nF) events, as well as reward pulling (RP) and non-reward pulling (nRP) events. (G) Narrowing down the type of event leads to more directed propagation patterns.—Duration and angle are weighted by smoothness. Markers in (B,C,E,F) refer to the average value per day. In (B,C) each point is the average of all events per day per mouse, while in (E,F) each point is the average of all events of a specific type per day per mouse. Within each box in (B-F), the central mark indicates the median, and the bottom and top edges of the box indicate the 25th and 75th percentiles, respectively. Control group n = 3 mice. P-values of statistical tests in S1 Table, “⋆” refers to difference in variance.

