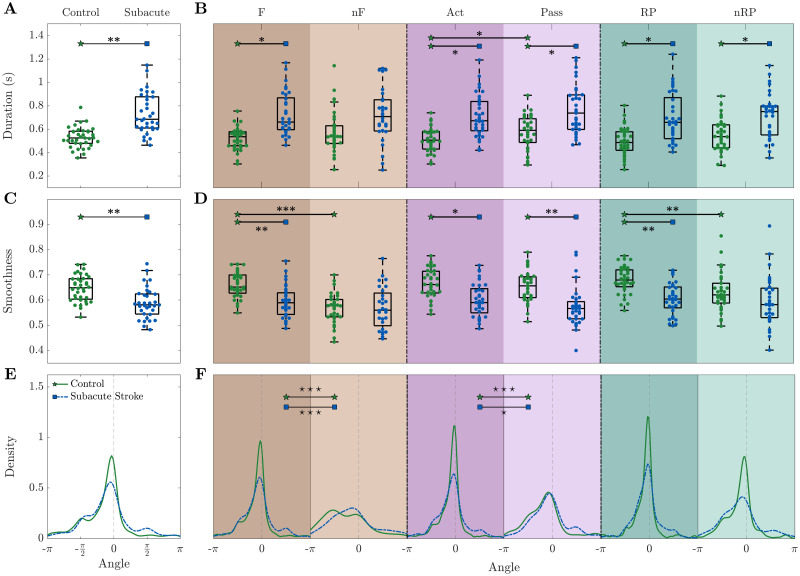
Fig 5. The subacute phase (one week after stroke) is characterized by an increase of the event duration and decrease of smoothness.
During the subacute phase, (A-B) the event duration is increased, (C-D) smoothness is decreased, and (E-F) the direction of propagation is more spread.—Results refer to the first week of recording after stroke. Duration and angle are weighted by smoothness. Markers in (A-D) refer to the average value per day. In (A,C) each point is the average of all events per day per mouse, while in (B,D) each point is the average of all events of a specific type per day per mouse. Within each box in (A-D), the central mark indicates the median, and the bottom and top edges of the box indicate the 25th and 75th percentiles, respectively. Control n = 8 mice, Subacute Stroke n = 8 mice. See S2 Table for p-values of statistical tests, “⋆” refers to difference in variance and “*” refers to difference in mean.

