. 2020 Jun 29;11(28):7429–7437. doi: 10.1039/d0sc00293c

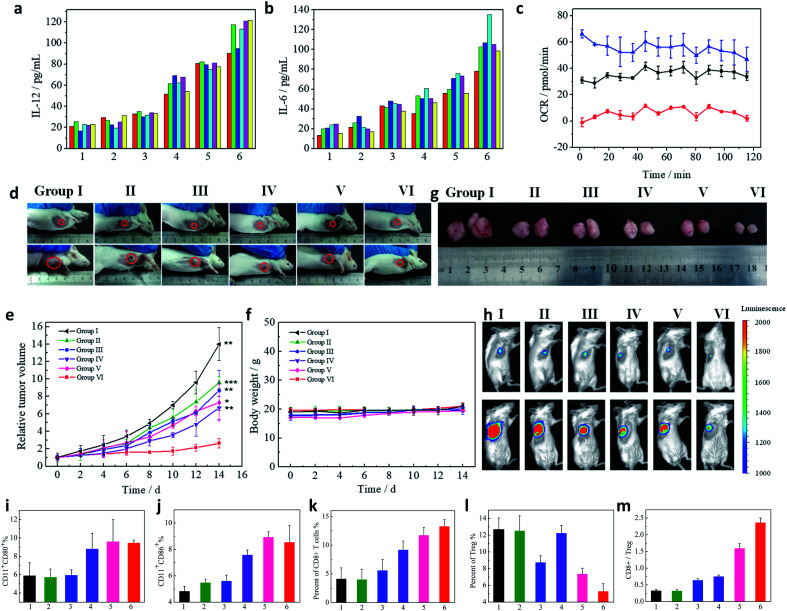
Fig. 4. Serum IL-12 (a) and IL-6 (b) levels of mice treated for 12 h with 1, NS; 2, CaP; 3, CaIP; 4, CaPC; 5, LIPC; and 6, CaIPC. The colorful columns represent six mice in each group. The mitochondrial oxygen consumption rate (OCR) of lymphocytes treated with RPMI 1640 (Black), RPMI 1640 with Ca2+ (Blue), or RPMI 1640 with BAPTA-AM (Red) (c). In vivo tumor therapy and antitumor efficacy. Photographs of mice taken before treatment (day 0) and at day 14 with different treatments: I, NS; II, CaP; III, CaIP; IV, CaPC; V, LIPC; and VI, CaIPC (d), tumor growth curves (e) and mice body weight curves (f) (n = 8). P values were calculated using the t-test (***P < 0.001, **P < 0.01, and *P < 0.05) to compare other groups with group VI. The data are presented as mean ± SD. Photographs of tumors harvested from the mice after 14 days (g). Bioluminescence images were obtained before treatment (day 0) and at day 14 with different treatments (h). Flow cytometry analysis of the CD 80 (i) and CD 86 (j) expressions of splenocytes. Proportions of CD8+ T cells (gated on CD3+ T cells) (k), Tregs (l), and CD8+/Tregs (m) in tumors of mice treated with I, NS; II, CaP; III, CaIP; IV, CaPC; V, LIPC; and VI, CaIPC. The injected doses of IDOi and CpG ODNs were respectively 600 μg kg−1 and 500 μg kg−1 each time.

Fig. 4