. 2020 May 27;11(22):5819–5829. doi: 10.1039/d0sc01255f

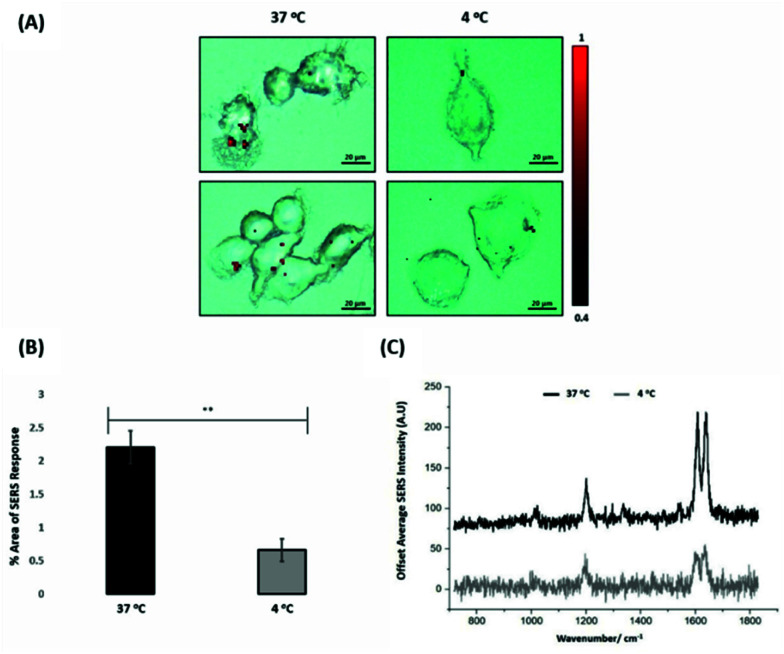
Fig. 3. ERα-AuNPs enter MCF-7 cells in a temperature dependent manner (A) SERS map of MCF-7 cells treated with ERα-AuNPs (60 pM) for 2 h at 37 °C (left) and 4 °C (right). The images were generated using a Renishaw InVia Raman microscope with 50× magnification NIR APO Nikon water immersion objective with a 0.75 NA and 1.2 mW laser power (10% power) from a HeNe 633 nm excitation source with step size y,x 1.0 μm, 0.1 s acquisition time and a 1200 L mm−1 grating in high confocality mode. The red false colour images, representing ERα-AuNPs, were generated using WiRE™ Renishaw plc 4.4 software and direct classical least square analysis (DCLS) based on a BPE Raman reporter spectrum. Results are representative of 3 independent experiments (SERS mapping of 10 cells in each experiment). Scale bars = 20 μm. (B) Percentage of relative SERS response value in MCF-7 cells incubated with ERα-AuNPs (60 pM for 2 h) at 37 °C (black) and 4 °C (grey). The area was calculated using the Fiji image processing package by calculating the red pixel number, corresponding to ERα-AuNPs, and the mapped cell area. The average of ten samples from three independent biological replicates is shown. Error bars presented as mean ± SD. *Significant difference (p < 0.05) in a Student's t-test. (C) Representative average SERS spectra of MCF-7 cells incubated with ERα-AuNPs (60 pM for 2 h) at 37 °C (black) and 4 °C (grey) calculated from 10 cells of 3 independent experiments.

Fig. 3