. 2020 May 27;11(22):5819–5829. doi: 10.1039/d0sc01255f

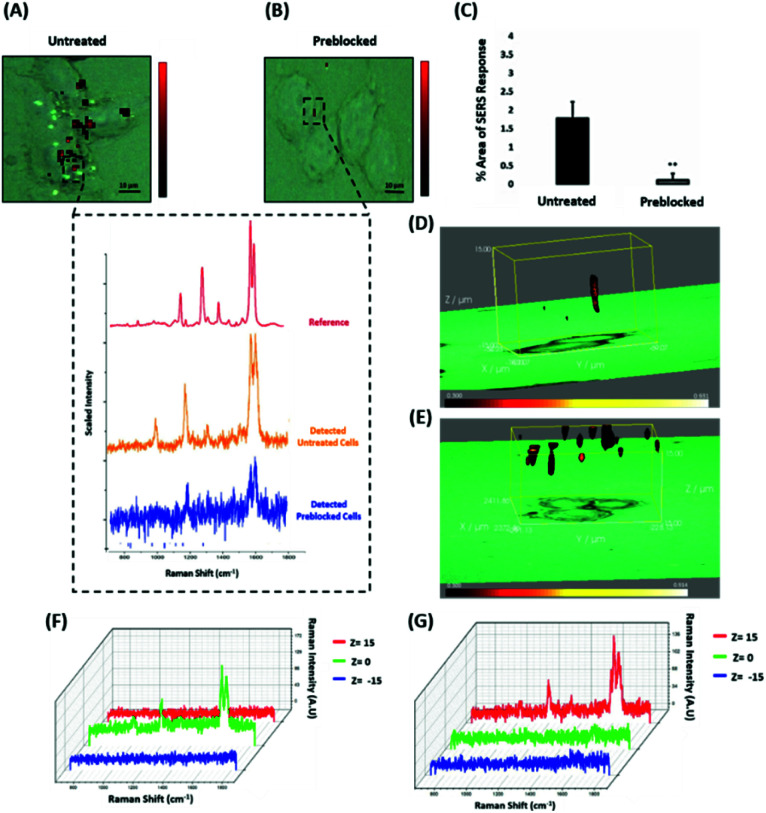
Fig. 5. ERα-AuNPs use mERα for their cellular uptake in MCF-7 cells. (A) False colour SERS map images for MCF-7 cells incubated with ERα-AuNPs (60 pM, 2 h) or (B) pre-blocked with free anti-ERα antibody (10 μg mL−1, 1 h) and then treated with ERα-AuNPs (60 pM, 2 h). The inset (dashed box) shows the average SERS spectra from untreated (orange) and pre-blocked with free anti-ERα antibody (blue) cells stacked with reference spectrum from nanotags (red). The images were generated using a Renishaw InVia Raman microscope with 50× magnification NIR APO Nikon water immersion objective with a 0.75 NA and 1.2 mW laser power (10% power) from a HeNe 633 nm excitation source with step size y,x 1.0 μm, 0.1 s acquisition time and a 1200 L mm−1 grating in high confocality mode. Scale bar = 10 μm. (C) Calculation of relative SERS response value for MCF-7 cells incubated with ERα-AuNPs (60 pM, 2 h) or pre-blocked with free anti-ERα antibody (10 μg mL−1, 1 h) and then treated with ERα-AuNPs (60 pM, 2 h). The calculations were carried out using WiRE™ – Renishaw plc 4.4 and Fiji image processing package. The average from three independent biological replicates is shown. Error bars presented as mean ± SD. (D) 3D SERS map from MCF-7 cells treated with ERα-AuNPs (60 pM, 2 h) and (E) MCF-7 cells pre-blocked with free anti-ERα antibody (10 μg mL−1, 1 h) and then treated with ERα-AuNPs (60 pM, 2 h). 3D SERS images were generated using the same conditions as those stated above for 2D mapping (Fig. 5A and B) except a step size of z = 3.0 was also employed. (F) 3D Raman mapping waterfall plot of average SERS spectra into different z-axis points, z = 15 μm (red), z = 0 μm (green) and z = −15 μm (blue) from MCF-7 cells treated with only ERα-AuNPs (60 pM, 2 h) or (G) with free anti-ERα antibody (10 μg mL−1, 1 h) and then treated with ERα-AuNPs (60 pM, 2 h).

Fig. 5