. 2020 Jun 22;11(27):7244–7251. doi: 10.1039/d0sc01149e

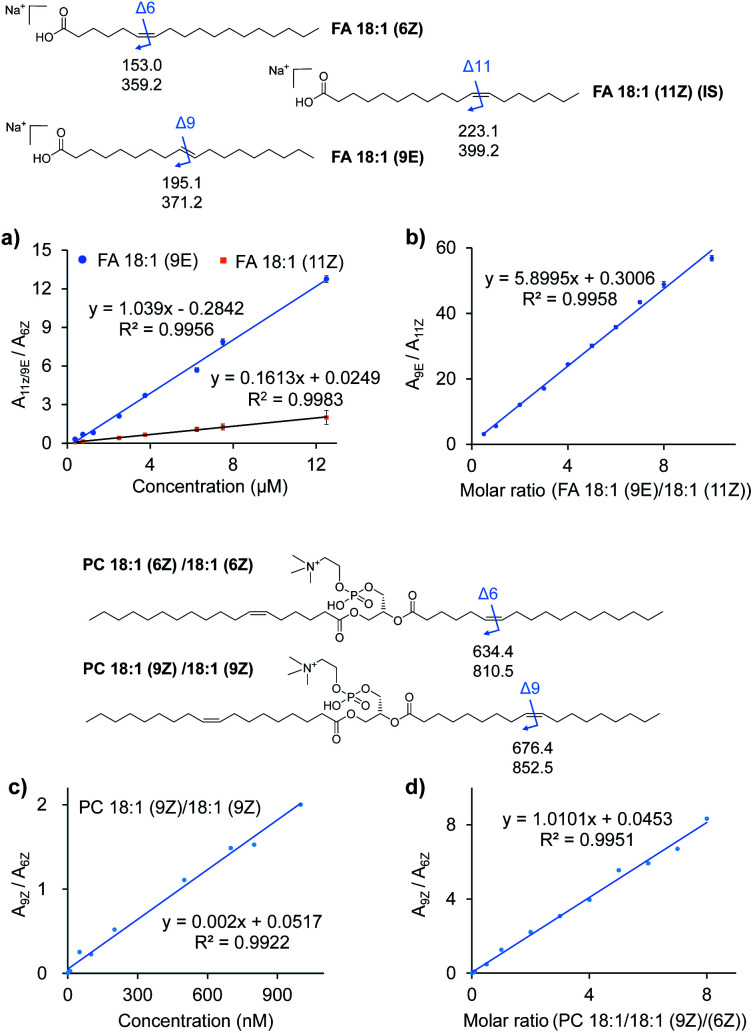
Fig. 3. Quantitative analysis of lipid C Created by potrace 1.16, written by Peter Selinger 2001-2019 C location isomers. (a) Calibration curves for quantitation of FA 18:1 (9E) and FA 18:1 (11Z) using FA 18:1 (6Z) as the internal standard. (b) Linear relationship established between the peak area ratio (A9E/A11Z) of the diagnostic ions and molar ratio (C9E/C11Z) of the two FA 18:1 C Created by potrace 1.16, written by Peter Selinger 2001-2019 C location isomers. (c) Calibration curves for quantitation of PC 18:1 (9Z)/18:1 (9Z) using PC 18:1 (6Z)/18:1 (6Z) as the internal standard. (d) Linear relationship established between the peak area ratio (A9Z/A6Z) of the diagnostic ions and molar ratio (C9Z/C6Z) of the two PC 18:1/18:1 C Created by potrace 1.16, written by Peter Selinger 2001-2019 C location isomers. The chemical structures of the lipids show the positions of C Created by potrace 1.16, written by Peter Selinger 2001-2019 C bonds and the m/z values of the possible diagnostic fragment ions of VACA reaction products via CID.

Fig. 3