. 2020 Jun 17;11(28):7292–7301. doi: 10.1039/d0sc01234c

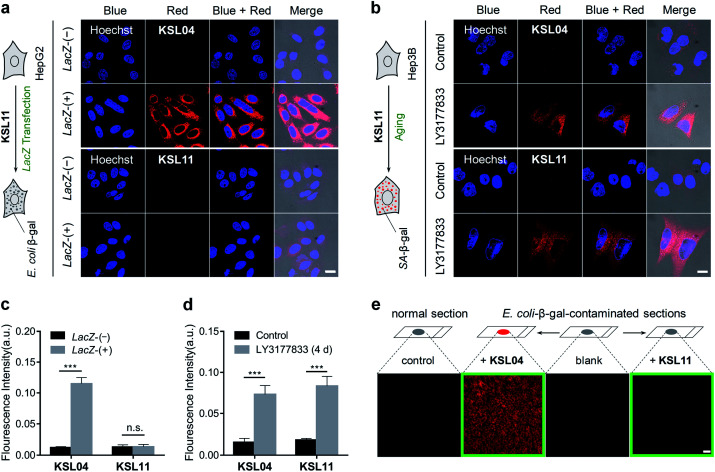
Fig. 8. Comparison of non-selective KSL04 and selective KSL11 in the detection of different biological samples. (a and b) Confocal images of HepG2 or Hep3B cells co-stained with probe (10 μM KSL04 or 10 μM KSL11) and Hoechst (2 μg mL−1), respectively; scale bar: 20 μm. (a) lacZ-(−) HepG2 cells without overexpressed E. coli β-gal, and lacZ-(+) HepG2 cells with overexpressed E. coli β-gal; intensity of laser line UV (405 nm): 10%; gain of PMT (660–750 nm): 700. (b) Hep3B cells were cultured in the presence or absence of the CDC7 inhibitor LY3177833 (senescence inducer) at 10 μM concentration for 4 days before staining with probes; intensity of laser line UV (405 nm): 10%; gain of PMT (660–750 nm): 900. (c) Quantified fluorescence intensity in red channel of (a); error bars represent the standard deviation (±S.D.) with n = 4. (d) Quantified fluorescence intensity in red channel of (b); error bars represent the standard deviation (±S.D.) with n = 4. (e) Confocal images of E. coli-β-gal-contaminated kidney sections after incubation with KSL04 (10 μM) and KSL11 (10 μM) for 1 h, respectively; the kidney sections were derived from a 1 month-old C57BL/6J male mouse and pretreated with 200 U mL−1E. coli β-gal solution for 0.5 h at 37 °C; scale bar: 100 μm; intensity of laser line UV (405 nm): 20%; gain of PMT (660–750 nm): 900. Blue channel: λex = 405 nm, λem = 430–490 nm; red channel: λex = 405 nm, λem = 660–750 nm. n.s. indicates no significance difference, ***P < 0.001, two-sided Student's t-test.

Fig. 8