. 2020 Apr 20;11(29):7641–7653. doi: 10.1039/d0sc01949f

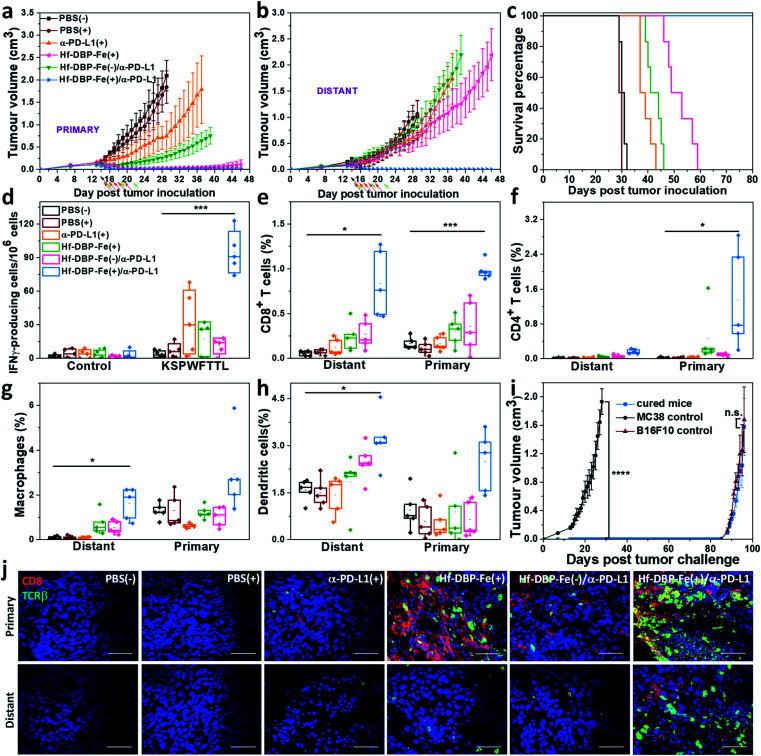
Fig. 6. Abscopal effect of Hf-DBP-Fe(+)/α-PD-L1 on an MC38 bilateral model. Primary (a) and distant (b) tumor growth curves of MC38 bilateral tumor-bearing mice treated with PBS(−), PBS(+), α-PD-L1 (+), Hf-DBP-Fe(+), or Hf-DBP-Fe/α-PD-L1(−), and Hf-DBP-Fe/α-PD-L1(+). Black, red, and green arrows correspond to PBS or Hf-DBP-Fe intratumoral injections at equivalent doses of 0.2 μmol per mouse, X-ray irradiation, and intraperitoneal antibody administration at a dose of 75 μg per mouse, respectively. n = 6. (c) Survival curves of MC38 bilateral tumor-bearing mice with the aforementioned treatments. (d) ELISPOT assay for the detection of tumor-specific IFN-γ producing T-cells. Splenocytes were harvested 12 days after the first treatment and were co-cultured with the stimulating KSPWFTTL peptide for 42 h. Percentages of tumor-infiltrating (e) CD8+ T cells, (f) CD4+ T cells, (g) macrophages, and (h) dendritic cells with respect to the total tumor cells, calculated by flow cytometric analysis. Data are shown as means ± s.d. (n = 6). *P < 0.05, **P < 0.01 and ***P < 0.001 by the t-test. Central lines, bounds of box and whiskers correspond to mean values, 25% to 75% of the range of data and 1.5 fold of interquartile range away from outliers, respectively. (i) Tumor growth curves after the treated mice challenged with MC38 cells and re-challenged with B16F10 cells. (j) CLSM imaging of immunostained tumor section slides of mice with the aforementioned treatment to show CD8+ T cells infiltration. Red and green fluorescence indicate CD8+ cells and TCRβ+ cells, respectively. Scale bar = 50 μm.

Fig. 6