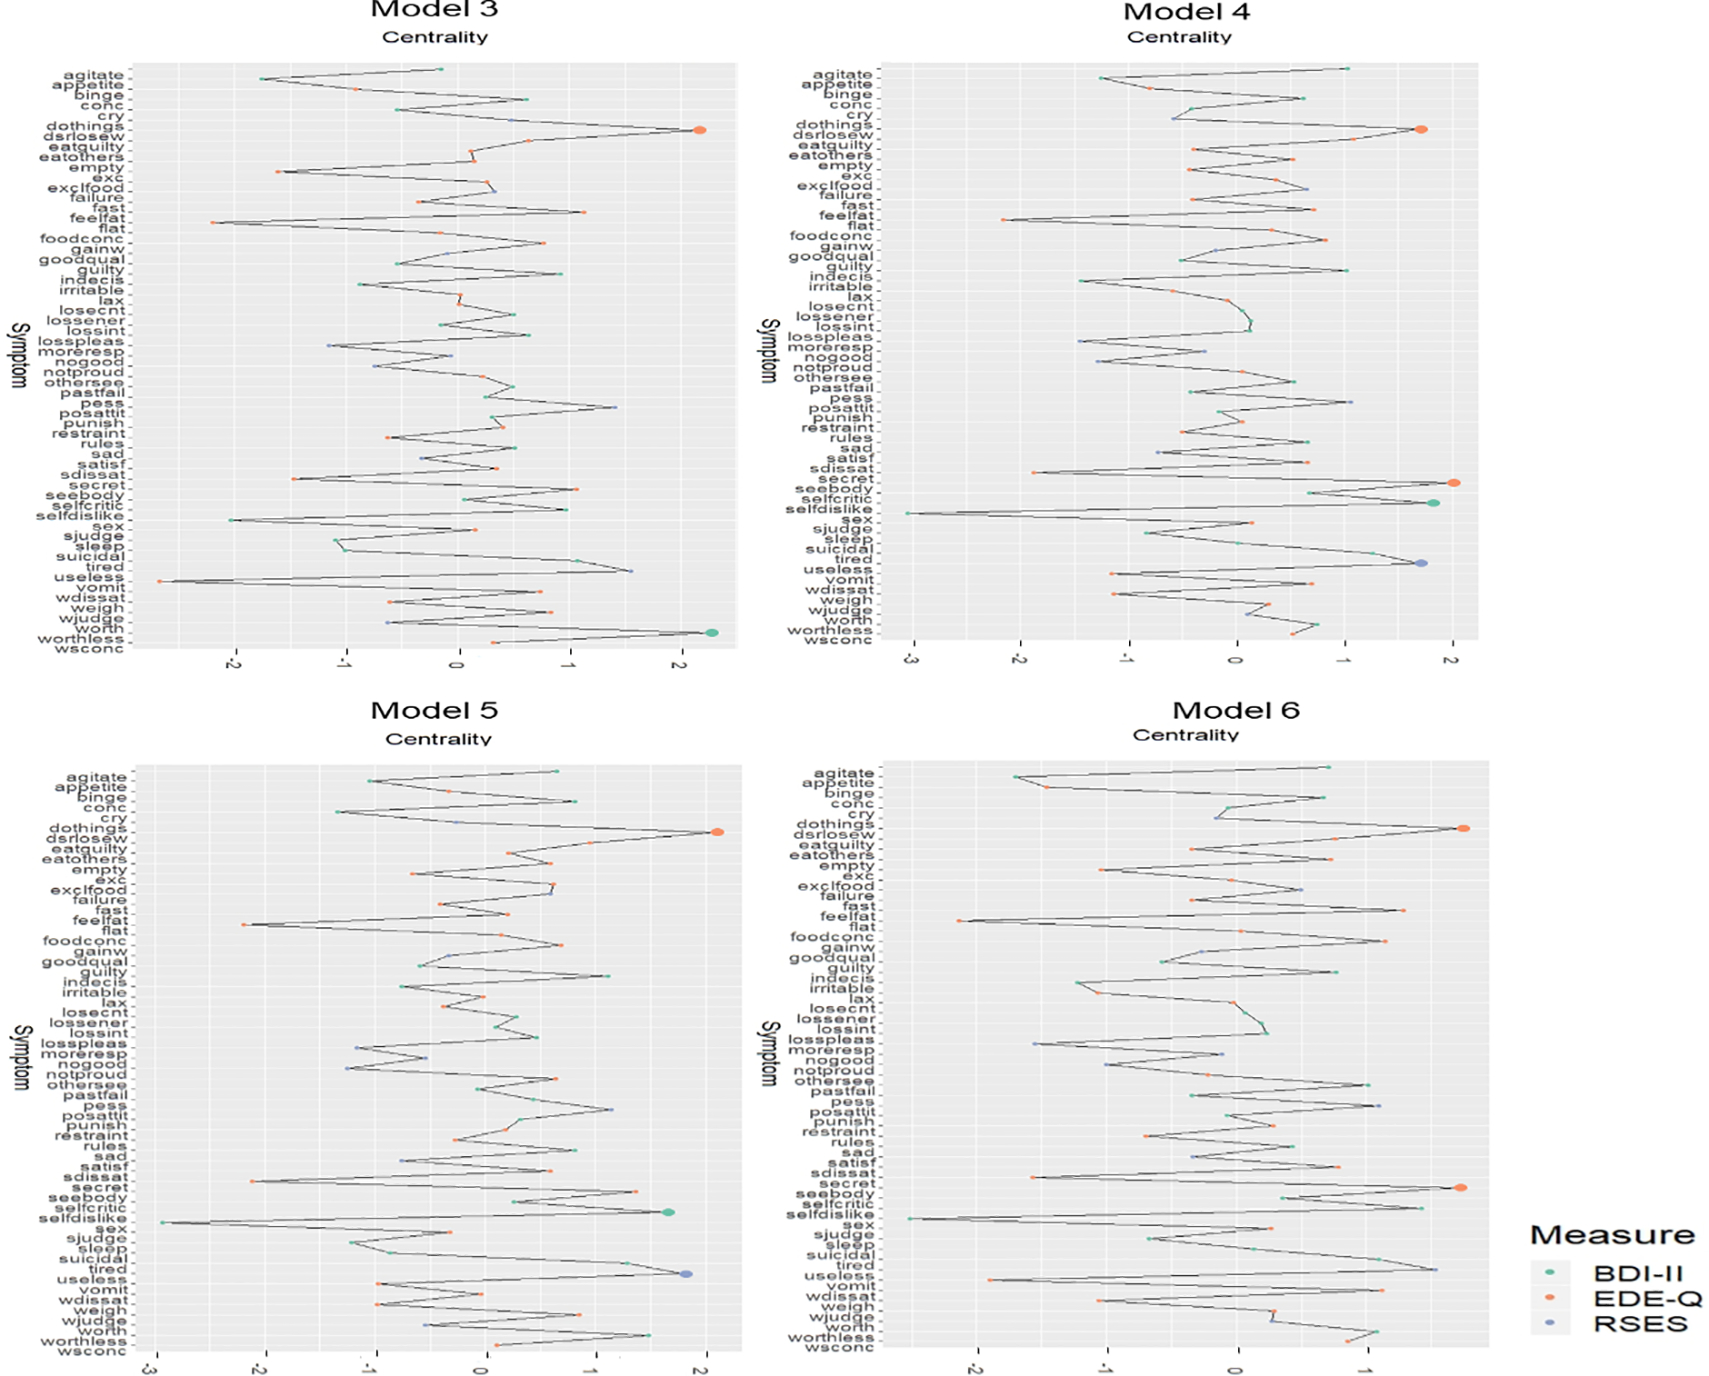
Figure 4. Models 3–6 centrality plots.

Notes: Orange items = EDE-Q items; purple items = RSES items; green items = BDI-II items. Larger dots denote the most central symptoms. Model 3 is made up of a college sample (n = 637). Model 4 is made up of an adolescent sample (n = 1,111). Model 5 is made up of a male sample (n = 757). Model 6 is made up of a female sample (n = 991). See Table 2 for a list of all node names and their corresponding symptoms/measure items.
