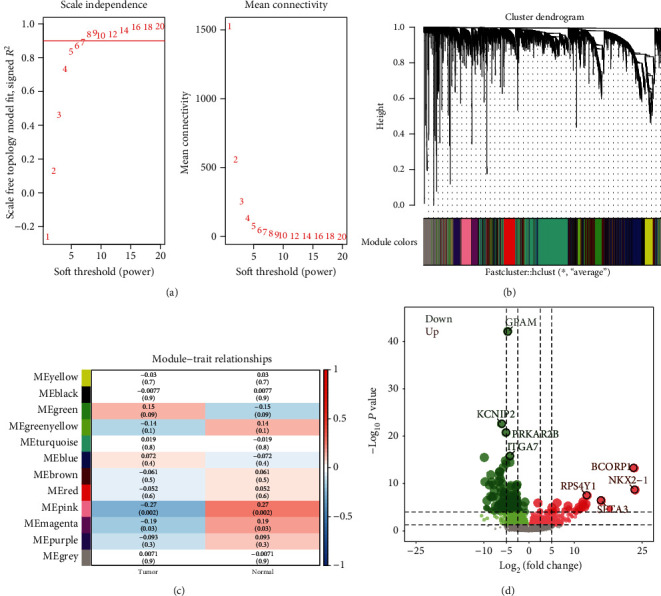
Figure 1.

Coexpression analysis of gene expression in thymoma. (a) Determination of soft threshold power in coexpression analysis. The left image shows the scale-free fit index (y-axis) as a function of the soft-thresholding power (x-axis). The right image shows the average connectivity (degree, y-axis) as a function of the soft-thresholding power (x-axis). (b) Module cluster tree of thymoma genes with large variance. Branches with different colors correspond to different modules. (c) The correlation between module and clinical trait. Each row corresponds to a module, and each column corresponds to a feature. Each cell contains the corresponding correlation and P value. (d) The differentially expressed genes between thymoma and control. Red nodes were significantly upregulated genes, and green nodes were significantly downregulated genes.
