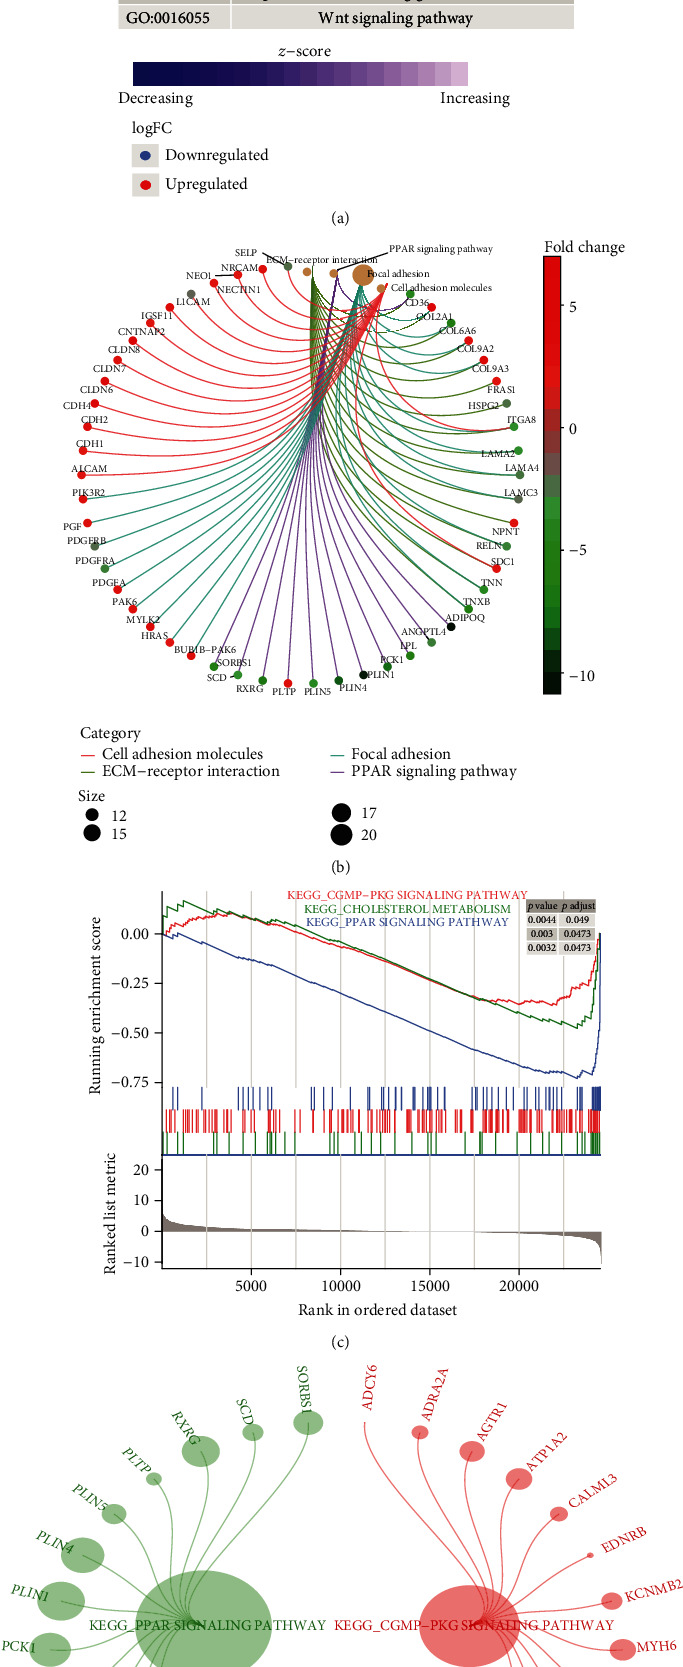
Figure 2.

Enrichment analysis of thymoma-related module genes. (a) Important genes were involved in biological processes. Red nodes are upregulated genes, and blue nodes are downregulated genes. (b) Important genes were involved in KEGG pathway. Different line colors represent different signaling pathways which genes involved in. (c) KEGG pathway in GSEA for important genes. These pathways were significantly upregulated in thymoma. (d) The DEGs involved in the same KEGG pathway in the results of enrichment and GSEA. Different colors represent genes involved in different signaling pathways.
