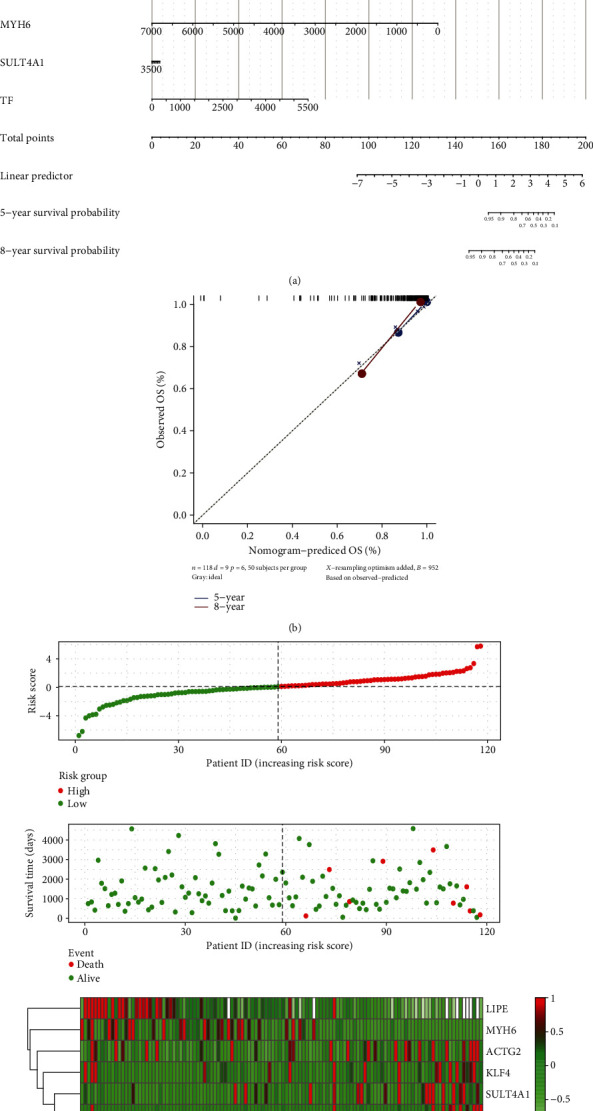
Figure 4.

The expression of key genes affects the prognosis of patients with thymoma. (a) Nomogram for predicting overall survival in patients with thymoma. (b) Plots depict the calibration of each model in terms of agreement between predicted and observed 5-year and 8-year outcomes. (c) Risk factor correlation diagram. The green dot was the survival thymoma patient, and the red dot was the dead thymoma patient. The dotted line was the median risk score, the left side was the low-risk group, and the right side was the high-risk group.
