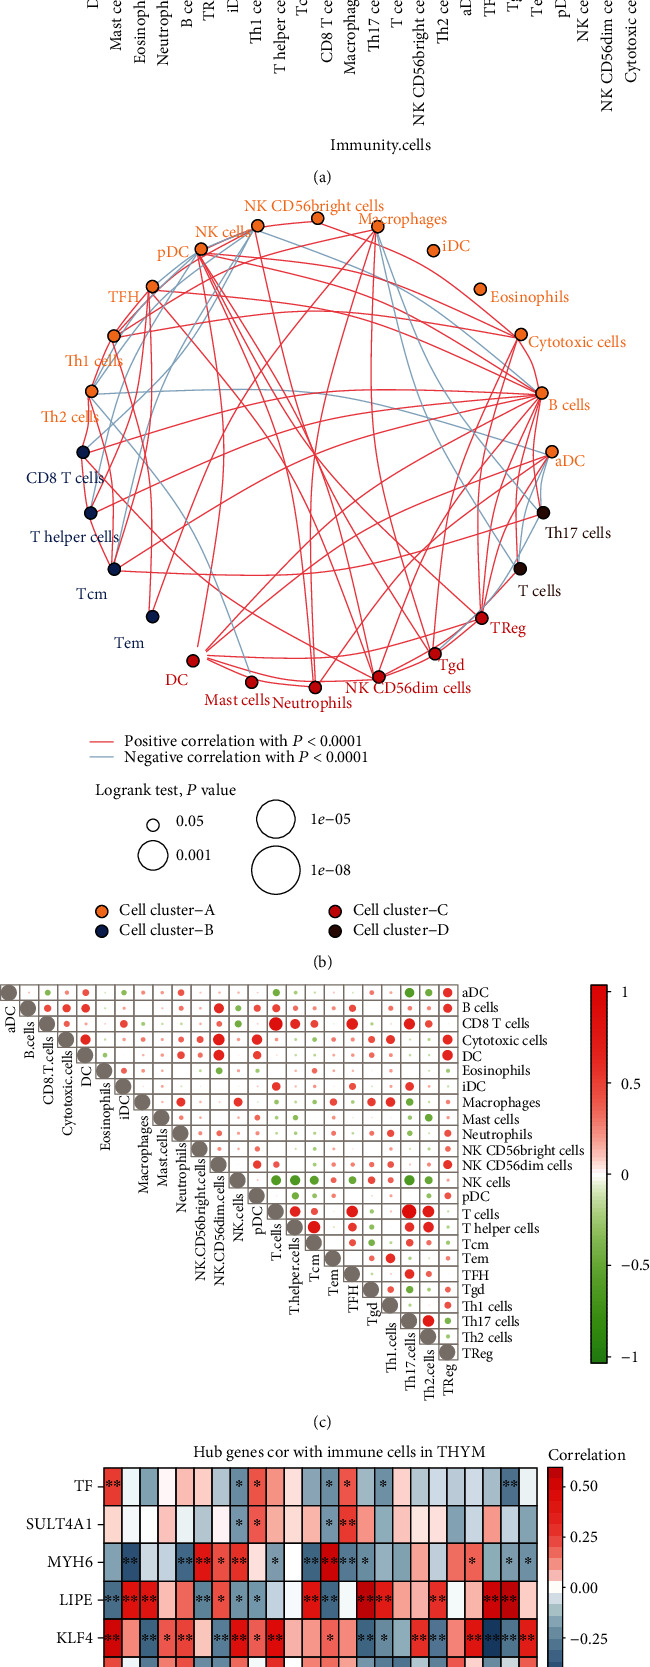
Figure 5.

Immune cell infiltration in thymoma. (a) The difference of immune cell infiltration between thymoma and control. The blue line represents a significant difference. (b) Clustering of immunocytes with differential infiltration. The red line represents the positive correlation between immune cells, and the blue line represents the negative correlation. (c) Correlation between immune cells in thymoma. Red represents positive correlation between immune cells, and blue line represents negative correlation. The size of the node represents the size of the correlation coefficient. (d) Correlation between key genes and immune cells. Red represents positive correlation between immune cells, and blue line represents negative correlation. ∗P < 0.05 and ∗∗P < 0.01.
